The devastation homicide inflicts on Black teens and adults in our nation is an ongoing crisis, yet it is all too often ignored outside of impacted communities. Black men have shorter life expectancies compared to white men in the United States, with homicide being a leading contributor to this disparity.1 Every year the Black population in the U.S. experiences thousands of excess firearm homicide deaths and this number rose dramatically during the COVID-19 pandemic.2
This study examines Black homicide victimization in the United States by analyzing two data sources: 2024 Web-based Injury Statistics Query and Reporting System (WISQARS) mortality data from the federal Centers for Disease Control and Prevention (CDC) and crime data submitted by states to the Federal Bureau of Investigation (FBI).
Prior editions of this report used exclusively FBI crime data. However, in January of 2021 the FBI changed the way crime data are collected — which negatively impacted the reliability of data submitted by some states. As a result, in this study (as in the prior editions analyzing 2022 and 2023 data) the more comprehensive and reliable CDC data are used to present information on victim mortality on the national and state levels, rank the 10 states with the highest victimization rates, and detail firearm and other weapon use. FBI crime data are used to describe the victim and offender relationship as well as homicide circumstances (information not available in WISQARS) on the national level and for the 10 states with the highest victimization rates. FBI crime data reporting varies by state, so while this report publishes the information that is available, the data may not be entirely representative of crime patterns in a given state.
National Data
According to CDC mortality data, in 2024 there were 10,533 Black homicide victims in the United States (Table 1).3 The homicide rate4 among Black victims in the United States was 22.4 per 100,000. For that year, the national homicide rate was 6.2 per 100,000. For white victims, the national homicide rate was 3.5 per 100,000. The Black homicide victimization rate was more than three and a half times the overall homicide victimization rate (22.4 per 100,000 compared to 6.2 per 100,000) and more than six times the white homicide victimization rate (22.4 per 100,000 compared to 3.5 per 100,000).
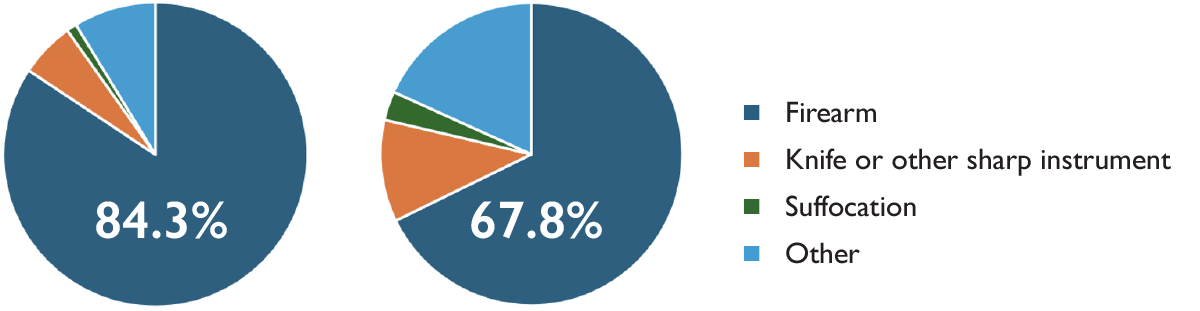
Firearms are more commonly used in homicides with Black victims compared to victims of other races. In 2024, 84.3 percent of Black homicide victims were killed with firearms, compared to 67.8 percent of white victims. In addition, nearly 60 percent of all firearm homicide victims were Black.
Table 1. Homicide and firearm homicide victimization rates by race, 20245
| Total homicides | Homicide rate | Firearm homicides | Firearm homicide rate | Percentage of homicides that are firearm homicides | |
|---|---|---|---|---|---|
| Black | 10,533 (52.2%) | 22.4 | 8,882 (57.8%) | 18.9 | 84.3% |
| White | 8,565 (42.5%) | 3.5 | 5,804 (37.8%) | 2.4 | 67.8% |
| American Indian / Alaska Native | 366 (1.8%) | 7.8 | 210 (1.4%) | 4.5 | 57.4% |
| Asian6 | 337 (1.7%) | 1.4 | 209 (1.4%) | 0.8 | 62.0% |
| More than one race | 361 (1.8%) | 3.4 | 259 (1.7%) | 2.4 | 71.7% |
| Total | 20,162 (100.0%) | 6.2 | 15,364 (100.0%) | 4.7 | 76.2% |
These racial disparities are particularly concerning when considering the racial breakdown of the United States population. While only 13.7 percent of the overall U.S. population is Black, more than half of all homicide victims in 2024 were Black (52.2 percent) (Figure 1).
Figure 1. Black percentage of United States population (left figure); Black percentage of homicide victims (right figure), 20247
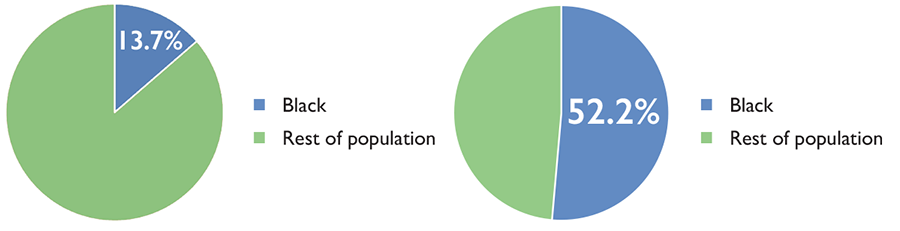
Figure 2. Homicide and firearm homicide victimization rates by race, 2018 — 20248
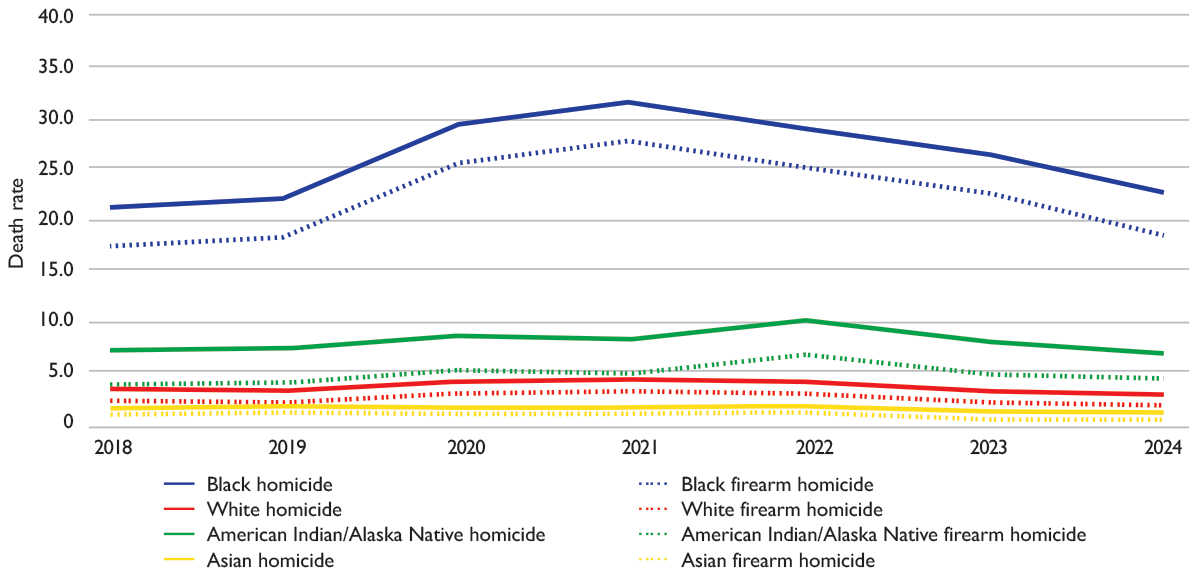
After increasing between 2018 and 2021, both homicide and firearm homicide rates decreased between 2021 and 2024 in the Black population (Figure 2). However, the Black homicide and firearm homicide rates in 2024 remain higher than rates in 2018 — six percent higher for homicide (21.2 per 100,000 in 2018 compared to 22.4 per 100,000 in 2024) and seven percent higher for firearm homicide (17.6 per 100,000 in 2018 compared to 18.9 per 100,000 in 2024).
Homicide was the number one cause of death among Black youth and young adults ages 10 to 24 in the United States in 2024, and the second leading cause of death among Black individuals ages one to nine and 25 to 34.9 In contrast, homicide was the third leading cause of death among White youth and young adults ages 15 to 24 in 2024 and the fourth leading cause of death among white children between the ages of one and nine years old.
Sex
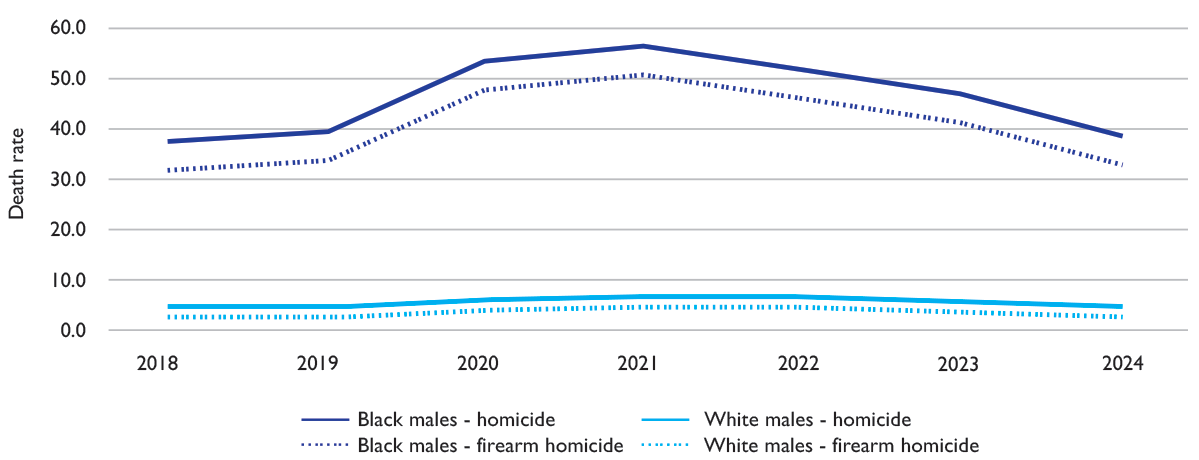
Of the 10,533 Black homicide victims, 8,982 (85.3 percent) were male and 1,551 (14.7 percent) were female. The homicide rate for Black male victims was nearly four times the overall rate for male homicide victims (39.0 per 100,000 compared to 9.8 per 100,00) and more than seven and a half times the rate for white male homicide victims (39.0 per 100,000 compared to 5.1 per 100,000) (Table 2). Figure 3 shows the disparity in homicide and firearm homicide rates for white and Black male victims. While homicide rates remained relatively stable for white males between 2018 and 2024, rates increased dramatically for Black males between 2019 and 2021, before decreasing in more recent years.
Figure 3. Homicide and firearm homicide victimization rates among males by race, 2018 — 202410
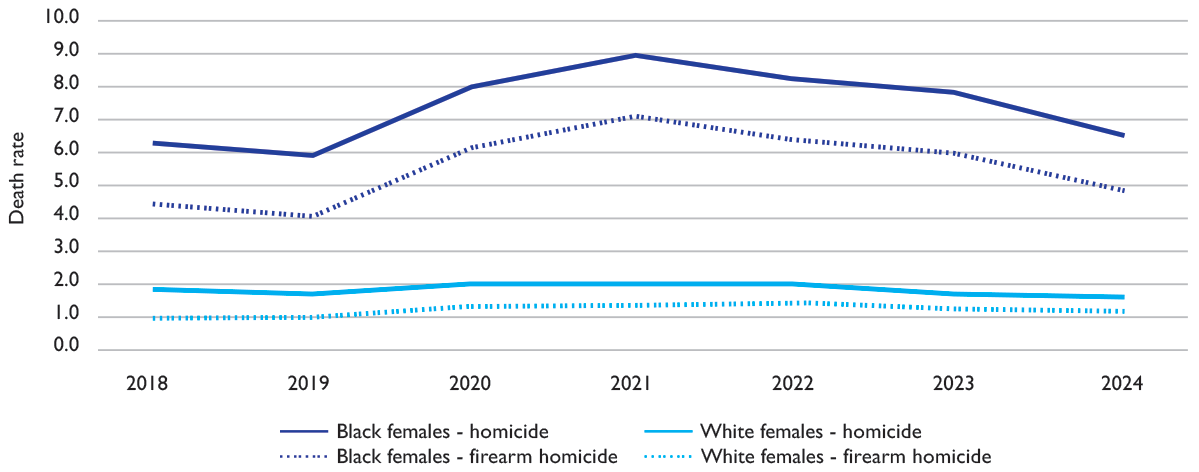
The homicide rate in 2024 for Black female victims was more than two and half times the overall rate for female homicide victims (6.5 per 100,000 compared to 2.5 per 100,000) and more than three and a half times the rate for white female homicide victims (6.5 per 100,000 compared to 1.8 per 100,000). The Black male homicide victimization rate was six times the Black female homicide victimization rate (39.0 per 100,000 compared to 6.5 per 100,000). Homicide and firearm homicide rates remained relatively stable for white females between 2018 and 2024 (Figure 4). Yet, similar to Black males, rates increased dramatically for Black females between 2019 and 2021 before decreasing in recent years.
Figure 4. Homicide and firearm homicide victimization rates among females by race, 2018 — 202411
Both male and female Black homicide victims are more likely to be killed with firearms compared to their white counterparts. In 2024, 71.2 percent of white male homicide victims were killed with firearms compared to 86.1 percent of Black male victims, while 58.2 percent of white female victims were killed with firearms compared to 74.2 percent of Black female victims (Table 2).
Table 2. Homicide and firearm homicide victimization by race and sex, 202412
| Male | Overall homicide count | Overall homicide rate | Firearm homicide count | Firearm homicide rate | Percentage of homicides that are firearm homicides |
|---|---|---|---|---|---|
| Black | 8,982 (56.0%) | 39.0 | 7,731 (60.7%) | 33.5 | 86.1% |
| White | 6,296 (39.2%) | 5.1 | 4,483 (35.2%) | 3.7 | 71.2% |
| American Indian / Alaska Native | 284 (1.8%) | 11.7 | 167 (1.3%) | 6.9 | 58.8% |
| Asian | 224 (1.4%) | 1.9 | 149 (1.2%) | 1.2 | 66.5% |
| More than one race | 265 (1.7%) | 5.1 | 208 (1.6%) | 3.9 | 78.5% |
| Total | 16,051 (100.0%) | 9.8 | 12,738 (100.0%) | 7.8 | 79.4% |
| Female | Overall homicide count | Overall homicide rate | Firearm homicide count | Firearm homicide rate | Percentage of homicides that are firearm homicides |
|---|---|---|---|---|---|
| Black | 1,551 (37.7%) | 6.5 | 1,151 (43.8%) | 4.8 | 74.2% |
| White | 2,269 (55.2%) | 1.8 | 1,321 (50.3%) | 1.1 | 58.2% |
| American Indian/ Alaska Native | 82 (2.0%) | 3.7 | 43 (1.6%) | 1.9 | 52.4% |
| Asian | 113 (2.7%) | 0.9 | 60 (2.3%) | 0.5 | 53.1% |
| More than one race | 96 (2.3%) | 1.7 | 51 (1.9%) | 0.9 | 53.1% |
| Total | 4,111 (100.0%) | 2.5 | 2,626 (100.0%) | 1.6 | 63.9% |
Age
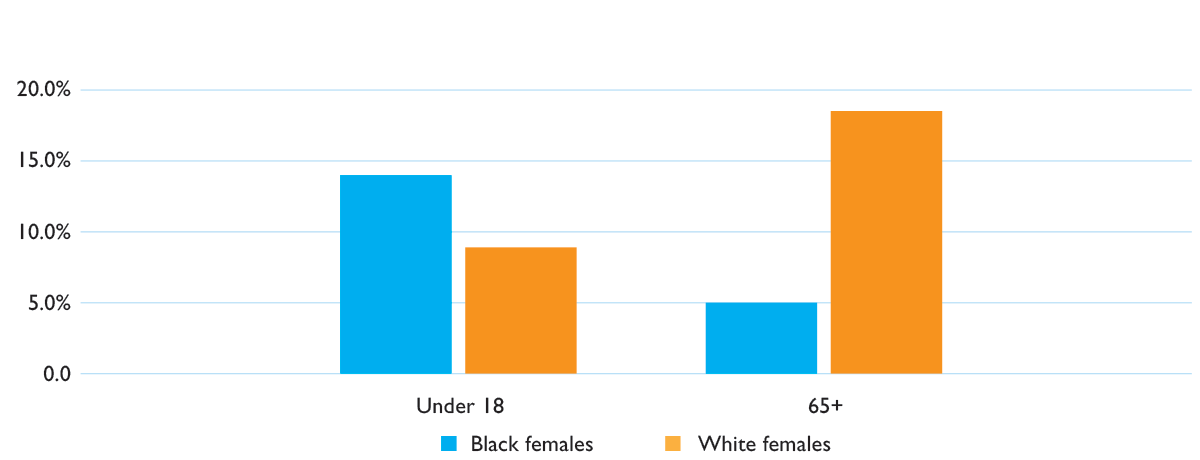
Among all Black homicide victims in 2024, 1,095 were under the age of 18 (10.4 percent) while 330 victims (3.1 percent) were 65 years of age or older. A slightly higher percentage of Black male victims were under the age of 18 compared to white male victims (9.8 percent compared to 8.0 percent), while a lower percentage of Black male victims were age 65 and older compared to their white counterparts (2.8 percent compared to 8.5 percent, Figure 5). The same pattern was seen among female homicide victims — 13.9 percent of Black female victims were under the age of 18 compared to 9.2 percent of white female victims, and 5.0 percent of Black female victims were age 65 and older compared to 18.6 percent for white female victims (Figure 6).
Figure 5. Male homicide victimization age by race, 202413
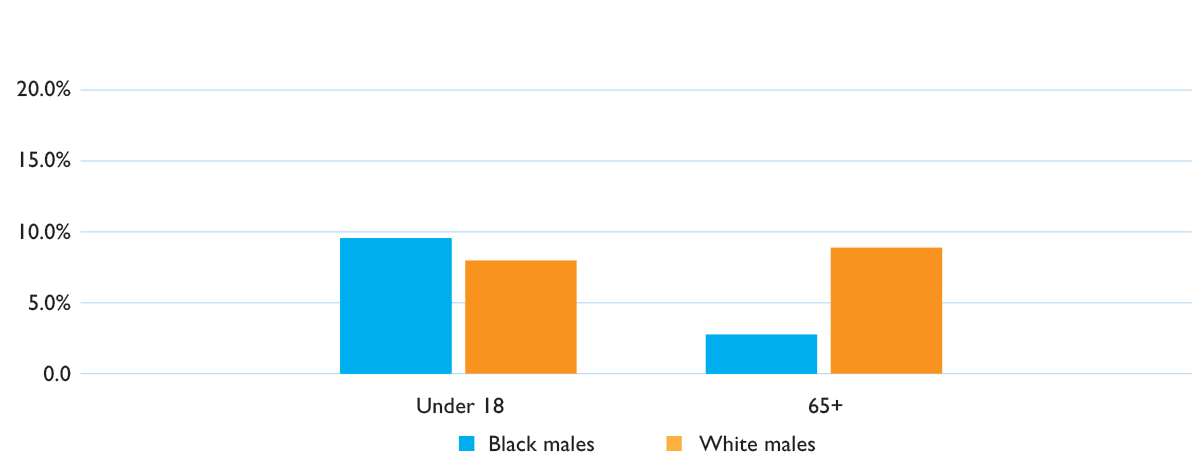
Figure 6. Female homicide victimization age by race, 202414
Most Common Weapons
A higher percentage of Black homicide victims were killed with firearms compared to white victims (Figure 7). In 2024, 84.3 percent of Black homicide victims were killed with firearms (8,882 out of 10,533) and 617 were killed with knives or other sharp instruments (5.9 percent). In comparison, 67.8 percent of white victims (5,804 out of 8,563) were killed with firearms while 934 (10.9 percent) were killed with knives or other sharp instruments.
Figure 7. Weapons used — Black victims (left figure); white victims (right figure),
202415
Continued Spotlight on Missouri
Missouri is First or Second in the Nation 18 Years in a Row for Black Homicide Victimization
In 2024, Missouri once again had the highest Black homicide victimization rate in the nation. For prior editions of this study using FBI crime data, Missouri ranked first or second from 2007 to 2020. Due to a change in 2021 in the way FBI crime data are reported, state rankings for the years 2021 and onward use CDC mortality data.16 Looking at both data sets, Missouri has ranked either first or second in the nation for Black homicide victimization 18 years in a row.
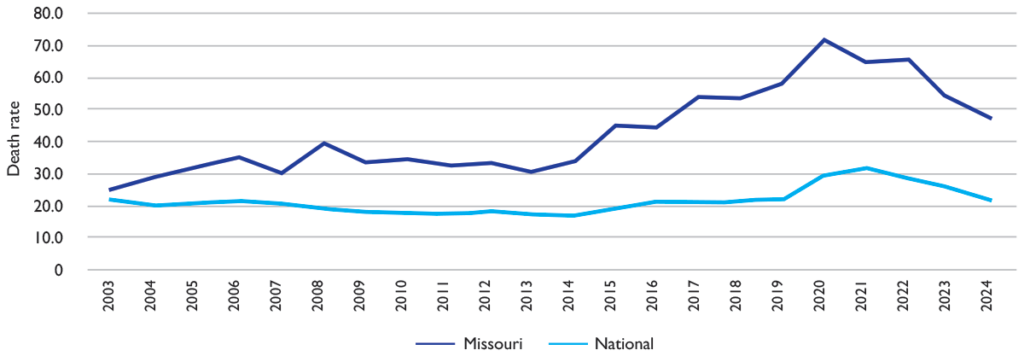
Between 2013 and 2022 the Black homicide victimization rate in Missouri more than doubled — from 30.7 per 100,000 in 2013 to 65.9 per 100,000 in 2022. Though this upward trend has since reversed and the homicide rate has returned to rates seen prior to the COVID-19 pandemic, Missouri still has the nation’s highest Black homicide victimization rate. In 2024, Black residents in Missouri died at a homicide rate more than twice the national rate — 48.3 per 100,000 compared to 22.4 per 100,000
(Figure 8).
Figure 8. Black homicide victimization rates in Missouri and the United States, 2003 — 202417
Black-White Racial Disparities in Homicide Rates by State
A further analysis of racial disparities in homicide victimization rates by state is presented in Figure 9. The figure ranks states by their Black homicide victimization rates, with the gray bars representing the Black homicide victimization rate and the red bars representing the white homicide victimization rate for each state.
After Missouri, the following states have the next highest Black homicide victimization rates: Mississippi (41.0 per 100,000); Illinois (38.6 per 100,000); Wisconsin (38.6 per 100,000); and, Tennessee (36.2 per 100,000). More information about the 10 states with the highest Black homicide victimization rates is available in Appendix One.
Click here to view a larger version of Figure 9.
Figure 9. Comparison of Black and white homicide victimization rates by state, ranked by Black homicide victimization rate, 202418
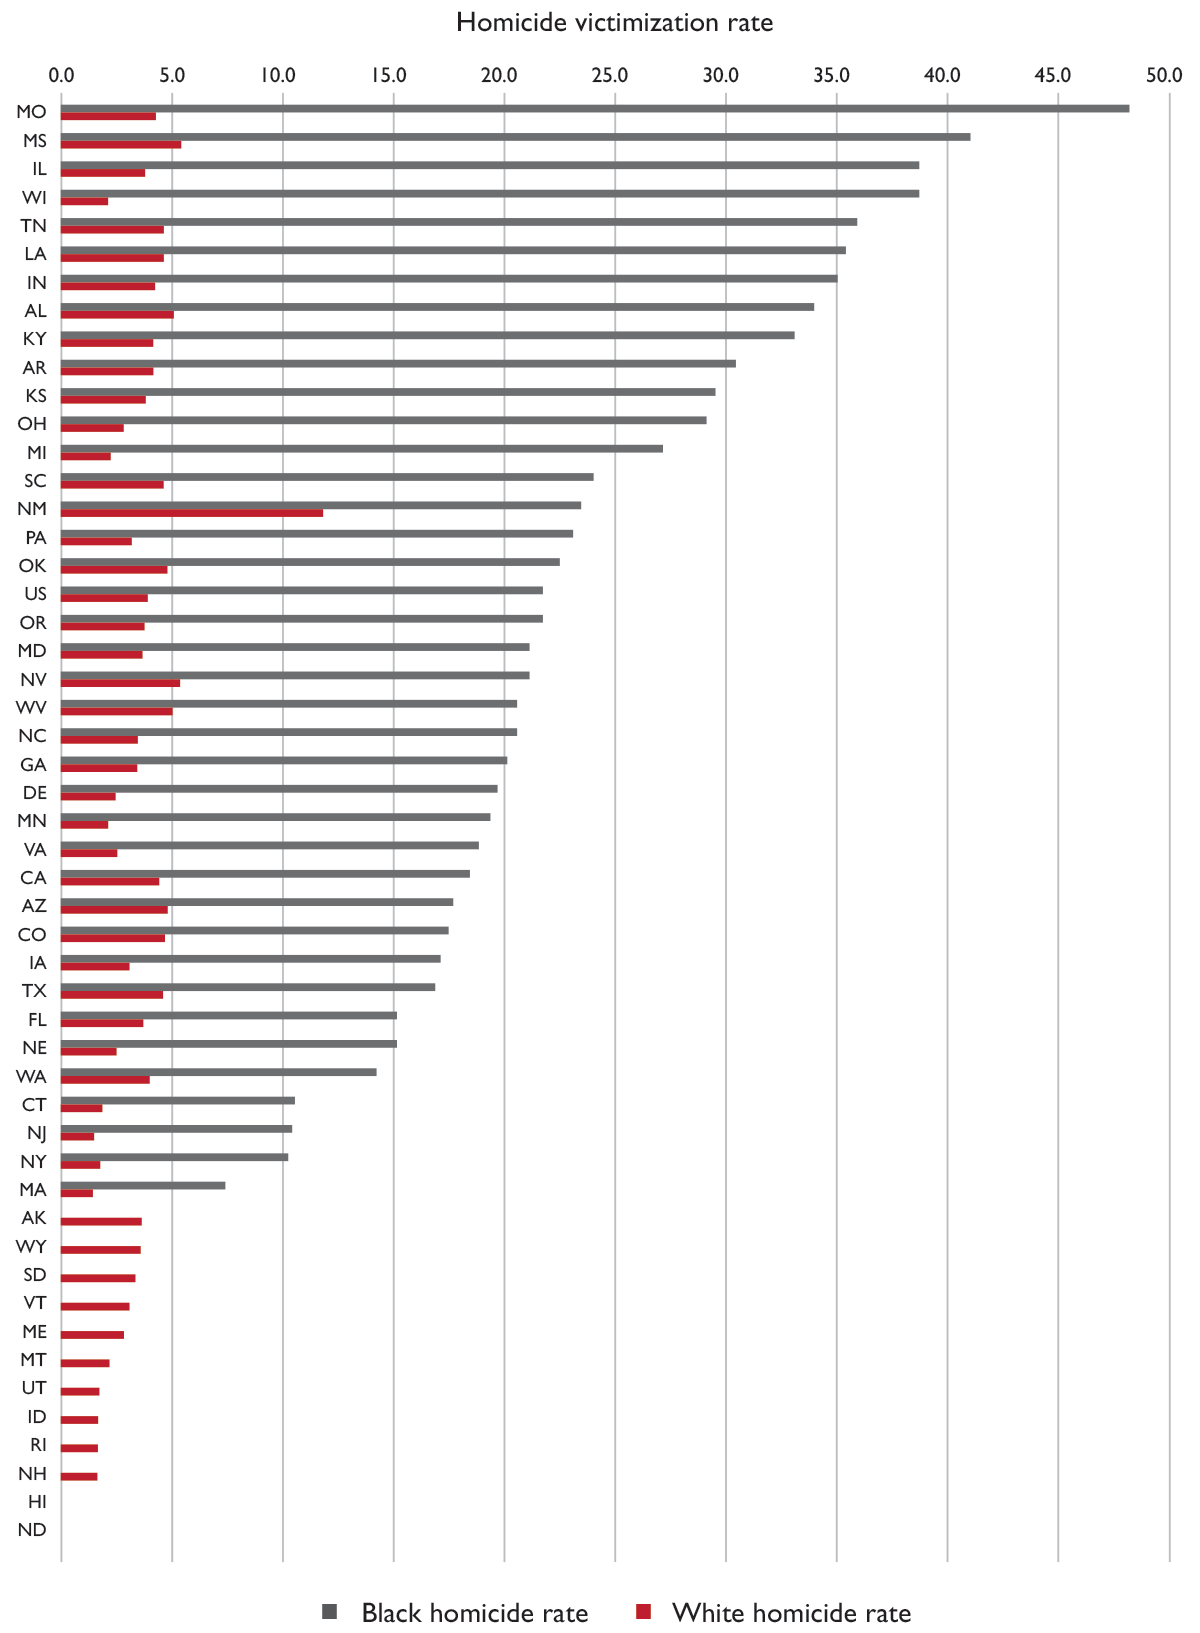
Note: Gray bars are not shown for states where the number of Black homicide victims in 2024 did not allow for the calculation of a stable rate (fewer than 10 victims). The same is true for states without red bars depicting the white homicide victimization rate.
Additional information about racial disparities is offered in Figure 10, which depicts the magnitude of difference between Black and white homicide victimization rates by state. For this Figure, the data from Figure 9 are reordered and ranked by the ratio19 of Black to white homicide victimization rates (shown on the far right of the figure). In 2024, Wisconsin had the largest disparity between Black and white homicide victimization rates — Black residents were 18.8 times more likely to die by homicide compared to white residents (38.6 per 100,000 compared to 2.1 per 100,000 respectively). This difference is nearly three times that of the overall United States, where Black individuals were 6.4 times more likely to die by homicide compared to white individuals (22.4 per 100,000 compared to 3.5 per 100,000). Michigan had the second largest disparity — Black residents were 13.6 times more likely to die by homicide compared to white residents (27.0 per 100,000 compared to 2.0 per 100,000 respectively).
Click here to view a larger version of Figure 10.
Figure 10. Ratio illustrating the difference between Black and white homicide victimization rates by state, 202420
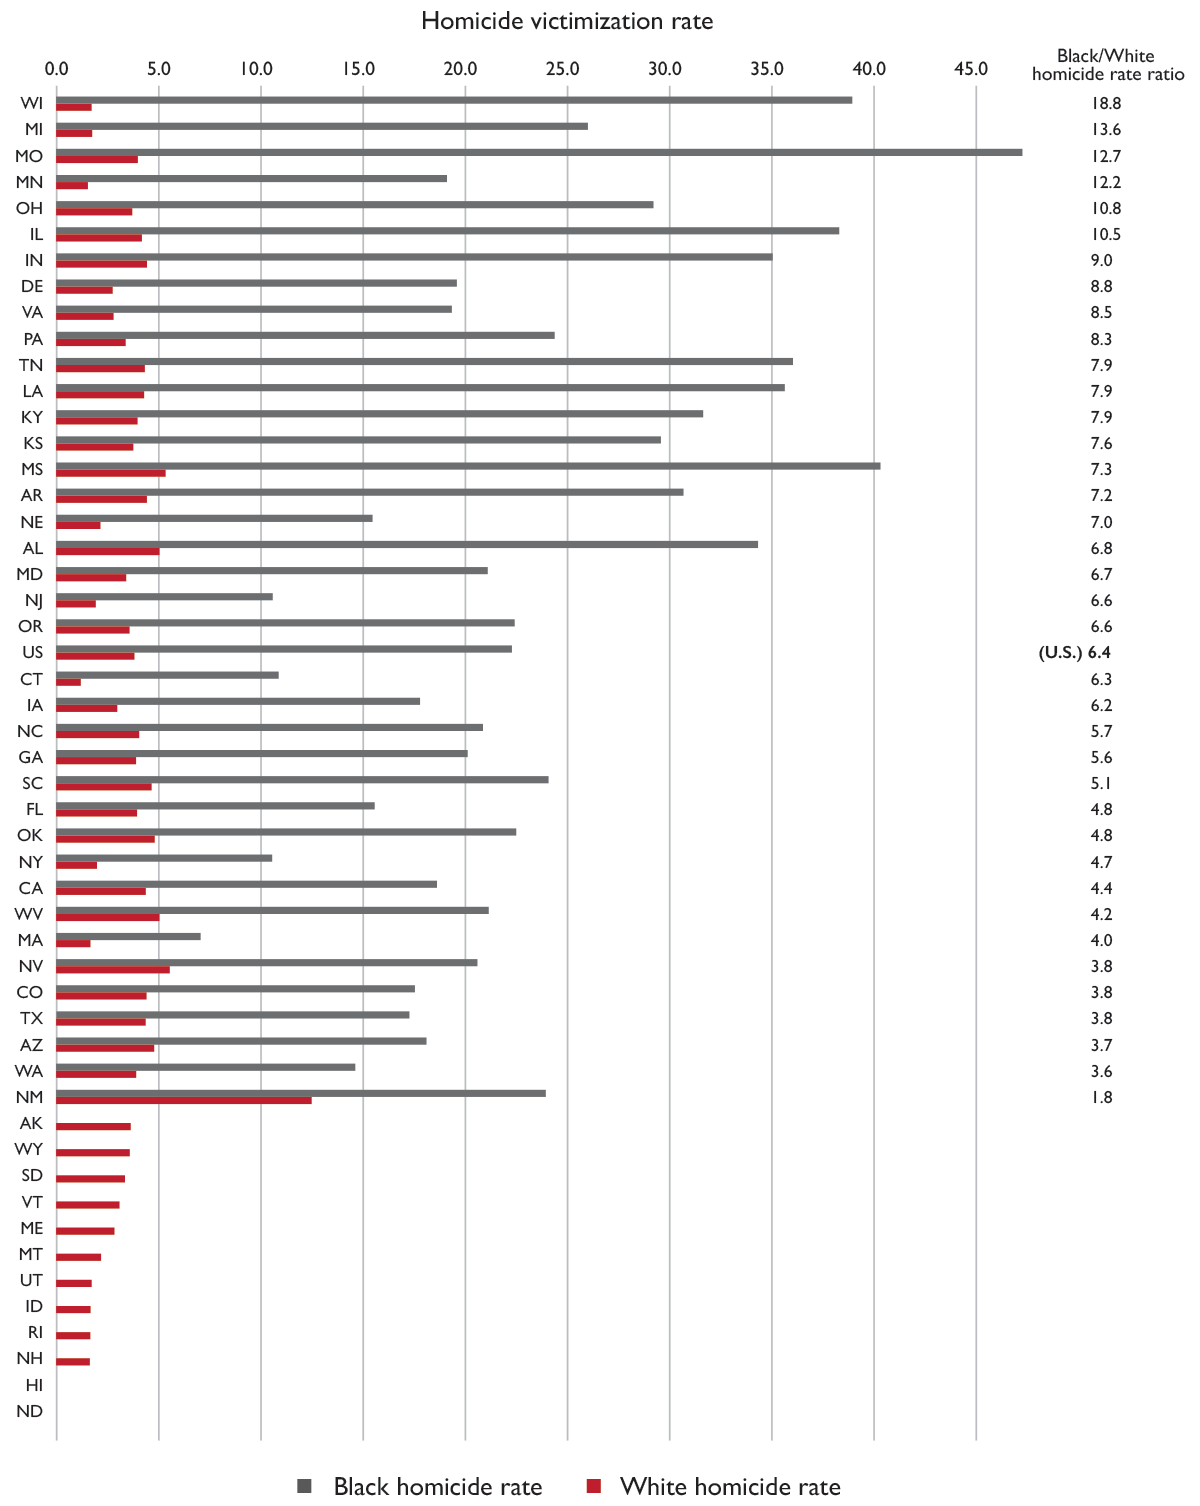
Note: Gray bars are not shown for states where the number of Black homicide victims in 2024 did not allow for the calculation of a stable rate (fewer than 10 victims). The same is true for states without red bars depicting the white homicide rate.
Victim/Offender Relationship and Circumstance Information From FBI Crime Data
As noted earlier, this report does not use 2024 FBI crime data for state rankings. It does, however, present information from this data source on victim to offender relationship as well as homicide circumstances (information not available in WISQARS) on the national level, as detailed below, and for the 10 states with the highest victimization rates.
Victim/Offender Relationship
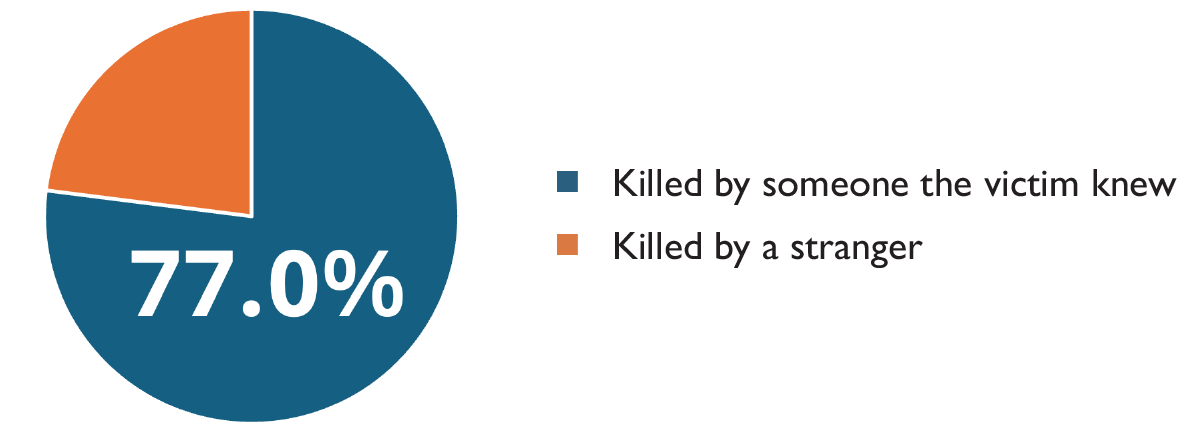
For homicides in which the victim to offender relationship could be identified, 77.0 percent of Black victims nationally (2,942 out of 3,820) were killed by someone they knew (Figure 11). Eight hundred seventy-eight victims were killed by strangers (23.0 percent).
Figure 11. Percent of Black homicide victims killed by someone they knew, 202421
Circumstance
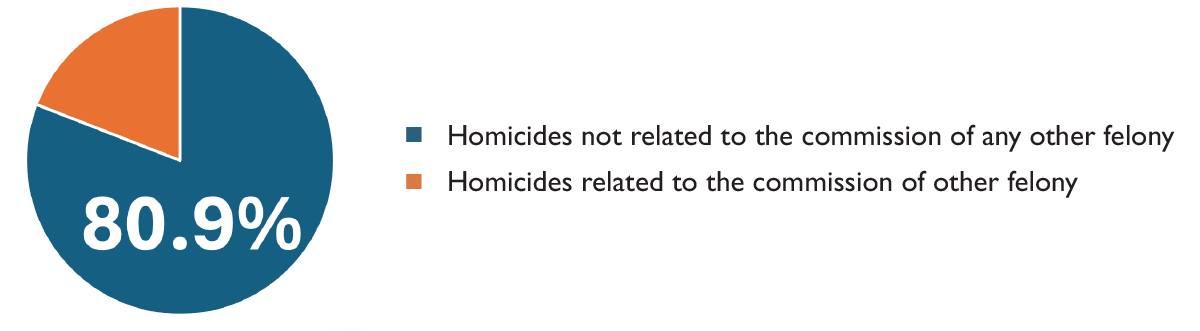
For homicides in which the circumstances could be identified, 80.9 percent (3,519 out of 4,350) were not related to the commission of any other felony (Figure 12). Of these, 56.1 percent (1,973 homicides) involved arguments between the victim and the offender.
Figure 12. Percent of homicides with Black homicide victims that were not related to the commission of any other felony, 202422
There were 87 incidents reported as justifiable homicides of Black victims killed by law enforcement in 2024. FBI crime data do not specifically identify killings by law enforcement that are not ruled justifiable.23
State Rankings
According to CDC mortality data, in 2024 the national Black homicide victimization rate was 22.4 per 100,000. For that year, Missouri ranked first as the state with the highest Black homicide victimization rate. The state’s rate of 48.3 per 100,000 was more than twice the national rate for Black homicide victimization. The 10 states with the highest Black homicide victimization rates are listed in Table 3. In order to ensure rankings contain stable rates, states with fewer than 10 Black homicide victims were not included in the rankings. These victims are included in the U.S. total and rate.
Additional information for the 10 states with the highest Black homicide victimization rates in 2024 can be found in Appendix One, including age and sex of victims and most common weapons used.
Table 3. Number of Black homicide victims and rates by state in 2024, ranked by rate24
| Ranking | State | Number of homicide deaths | Homicide rate |
|---|---|---|---|
| 1 | Missouri | 353 | 48.3 |
| 2 | Mississippi | 449 | 41.0 |
| 3 (tie) | Illinois | 708 | 38.6 |
| 3 (tie) | Wisconsin | 157 | 38.6 |
| 5 | Tennessee | 435 | 36.2 |
| 6 | Louisiana | 523 | 35.3 |
| 7 | Indiana | 263 | 35.0 |
| 8 | Alabama | 466 | 34.4 |
| 9 | Kentucky | 144 | 33.0 |
| 10 | Arkansas | 148 | 30.5 |
NOTE: Prior editions of this report published in 2023 and earlier used FBI crime data for state rankings; therefore, the state rankings in this report are not directly comparable to rankings published in reports from 2023 and earlier. Any comparisons with previous years should note this transition in data sources (FBI crime data to CDC mortality data).
Conclusion
Black Americans are disproportionately affected by homicide. For the year 2024, Black Americans represented 13.7 percent of the nation’s population yet accounted for 52.2 percent of all homicide victims. Nationally, Black individuals were 6.4 times more likely to die by homicide compared to their white counterparts, though this disparity was much higher in some states as detailed earlier in this report.
The devastation homicide inflicts on Black men, women, boys, and girls remains an ongoing national crisis that should be a top priority for policymakers to address. An important part of ending our nation’s gun violence epidemic will involve reducing homicide victimization in the Black community.
At the same time, the firearms industry, looking to expand beyond its shrinking base of white male gun owners, has increased its marketing efforts targeting Black, Latino, and Asian Americans.25 Such efforts can only increase gun death and injury in these communities.
In addition, individuals living in communities where violence is prevalent are at increased risk for a broad range of negative health and behavior outcomes. An increased understanding of how trauma resulting from community violence influences development, health, and behavior can lead to improvements in the way many social services are delivered as well as policy changes at the local, state, and federal levels.26
For Black victims of homicide, like all victims of homicide, guns are far and away the number-one murder tool. Successful efforts to reduce America’s Black homicide toll, like America’s homicide toll as a whole, must put a focus on reducing access and exposure to firearms.
Appendix One
Additional Information for the 10 States in 2024 with the Highest Rates of Black Homicide Victimization as well as the United States27 28
Note: The victim/offender relationship and circumstance data presented here are from FBI crime data.
Ranked 1st in the United States
There were 353 Black homicide victims in Missouri in 2024.
The homicide rate among Black victims in Missouri was 48.3 per 100,000 in 2024. Black victims were 12.7 times more likely to die by homicide compared to white victims in the state.
Age
Thirty-nine homicide victims were less than 18 years old (11.0 percent). Twelve victims were age 65 or older (3.4 percent).
Sex
Out of 353 homicide victims, 313 (88.7 percent) were male and 40 (11.3 percent) were female.
Most Common Weapons
Most victims were killed by firearms (89.5 percent or 316 out of 353). Fewer than 10 victims were killed with knives or other sharp instruments.
Victim/Offender Relationship
For homicides in which the victim to offender relationship could be identified, 68.2 percent of victims (122 out of 179) were killed by someone they knew. Fifty-seven victims were killed by strangers.
Circumstance
For homicides in which the circumstances could be identified, 76.2 percent (138 out of 181) were not related to the commission of any other felony. Of these, 64.5 percent (89 homicides) involved arguments between the victim and the offender.
Ranked 2nd in the United States
There were 449 Black homicide victims in Mississippi in 2024.
The homicide rate among Black victims in Mississippi was 41.0 per 100,000 in 2024. Black victims were 7.3 times more likely to die by homicide compared to white victims in the state.
Age
Forty-four homicide victims were less than 18 years old (9.8 percent). Sixteen were age 65 or older (3.6 percent).
Sex
Out of 449 homicide victims, 379 (84.4 percent) were male and 70 (15.6 percent) were female.
Most Common Weapons
Most victims were killed by firearms (89.1 percent or 400 out of 449). Twenty-one victims were killed with knives or other sharp instruments (4.7 percent).
Victim/Offender Relationship
For homicides in which the victim to offender relationship could be identified, 93.5 percent (43 out of 46) were killed by someone they knew. Fewer than 10 victims were killed by a stranger.
Circumstance
For homicides in which the circumstances could be identified, 89.8 percent (53 out of 59) were not related to the commission of any other felony. Of these, 56.6 percent (30 homicides) involved arguments between the victim and offender.
Tied for 3rd in the United States
There were 708 Black homicide victims in Illinois in 2024.
The homicide rate among Black victims in Illinois was 38.6 per 100,000 in 2024. Black victims were 10.5 times more likely to die by homicide compared to white victims in the state.
Age
Sixty homicide victims were less than 18 years old (8.5 percent). Fifteen victims were age 65 or older (2.1 percent).
Sex
Out of 708 homicide victims, 614 (86.7 percent) were male and 94 (13.3 percent) were female.
Most Common Weapons
Most victims were killed by firearms (86.3 percent or 611 out of 708). Thirty-two victims were killed with knives or other sharp instruments (4.5 percent).
Victim/Offender Relationship
For homicides in which the victim to offender relationship could be identified, 64.5 percent of victims (98 out of 152) were killed by someone they knew. Fifty-four victims were killed by strangers.
Circumstance
For homicides in which the circumstances could be identified, 88.0 percent (88 out of 100) were not related to the commission of any other felony. Of these, 56.8 percent (50 homicides) involved arguments between the victim and offender.
Tied for 3rd in the United States
There were 157 Black homicide victims in Wisconsin in 2024.
The homicide rate among Black victims in Wisconsin was 38.6 per 100,000 in 2024. Black victims were 18.8 times more likely to die by homicide compared to white victims in the state.
Age
Twenty-three homicide victims were less than 18 years old (14.6 percent). Fewer than 10 victims were age 65 or older.
Sex
Out of 157 homicide victims, 134 (85.4 percent) were male and 23 (14.6 percent) were female.
Most Common Weapons
Most victims were killed by firearms (85.4 percent or 134 out of 157). Fewer than 10 victims were killed with knives or other sharp instruments.
Victim/Offender Relationship
For homicides in which the victim to offender relationship could be identified, 68.3 percent of victims (41 out of 60) were killed by someone they knew. Nineteen victims were killed by strangers.
Circumstance
For homicides in which the circumstances could be identified, 75.0 percent (63 out of 84) were not related to the commission of any other felony. Of these, 49.2 percent (31 homicides) involved arguments between the victim and offender.
Ranked 5th in the United States
There were 435 Black homicide victims in Tennessee in 2024.
The homicide rate among Black victims in Tennessee was 36.2 per 100,000 in 2024. Black victims were 7.9 times more likely to die by homicide compared to white victims in the state.
Age
Fifty-three homicide victims were less than 18 years old (12.2 percent). Eighteen victims were age 65 or older (4.1 percent).
Sex
Out of 435 homicide victims, 366 (84.1 percent) were male and 69 (15.9 percent) were female.
Most Common Weapons
Most victims were killed by firearms (91.5 percent or 398 out of 435). Thirteen victims were killed with knives or other sharp instruments (3.0 percent).
Victim/Offender Relationship
For homicides in which the victim to offender relationship could be identified, 62.4 percent of victims (153 out of 245) were killed by someone they knew. Ninety-two victims were killed by strangers.
Circumstance
For homicides in which the circumstances could be identified, 69.5 percent (155 out of 223) were not related to the commission of any other felony. Of these, 56.8 percent (88 homicides) involved arguments between the victim and offender.
Ranked 6th in the United States
There were 523 Black homicide victims in Louisiana in 2024.
The homicide rate among Black victims in Louisiana was 35.3 per 100,000 in 2024. Black victims were 7.9 times more likely to die by homicide compared to white victims in the state.
Age
Fifty-five homicide victims were less than 18 years old (10.5 percent). Fifteen victims were age 65 or older (2.9 percent).
Sex
Out of 523 homicide victims, 440 (84.1 percent) were male and 83 (15.9 percent) were female.
Most Common Weapons
Most victims were killed by firearms (88.5 percent or 463 out of 523). Seventeen victims were killed with knives or other sharp instruments (3.3 percent).
Victim/Offender Relationship
For homicides in which the victim to offender relationship could be identified, 84.9 percent of victims (90 out of 106) were killed by someone they knew. Sixteen victims were killed by strangers.
Circumstance
For homicides in which the circumstances could be identified, 75.0 percent (63 out of 84) were not related to the commission of any other felony. Of these, 49.2 percent (31 homicides) involved arguments between the victim and offender.
Ranked 7th in the United States
There were 263 Black homicide victims in Indiana in 2024.
The homicide rate among Black victims in Indiana was 35.0 per 100,000 in 2024. Black victims were 9.0 times more likely to die by homicide compared to white victims in the state.
Age
Twenty-four homicide victims were less than 18 years old (9.1 percent). Fewer than 10 victims were age 65 or older.
Sex
Out of 263 homicide victims, 228 (86.7 percent) were male and 35 (13.3 percent) were female.
Most Common Weapons
Most victims were killed by firearms (87.5 percent or 230 out of 263). Thirteen victims were killed with knives or other sharp instruments (4.9 percent).
Victim/Offender Relationship
For homicides in which the victim to offender relationship could be identified, 77.2 percent of victims (61 out of 79) were killed by someone they knew. Eighteen victims were killed by strangers.
Circumstance
For homicides in which the circumstances could be identified, 64.1 percent (66 out of 103) were not related to the commission of any other felony. Of these, 56.1 percent (37 homicides) involved arguments between the victim and offender.
Ranked 8th in the United States
There were 466 Black homicide victims in Alabama in 2024.
The homicide rate among Black victims in Alabama was 34.4 per 100,000 in 2024. Black victims were 6.8 times more likely to die by homicide compared to white victims in the state.
Age
Forty-three homicide victims were less than 18 years old (9.2 percent). Fifteen victims were age 65 or older (3.2 percent).
Sex
Out of 466 homicide victims, 406 (87.1 percent) were male and 60 (12.9 percent) were female.
Most Common Weapons
Most victims were killed by firearms (90.3 percent or 421 out of 466). Seventeen victims were killed with knives or other sharp instruments (3.6 percent).
Victim/Offender Relationship
For homicides in which the victim to offender relationship could be identified, 84.0 percent of victims (105 out of 125) were killed by someone they knew. Twenty victims were killed by strangers.
Circumstance
For homicides in which the circumstances could be identified, 93.9 percent (185 out of 197) were not related to the commission of any other felony. Of these, 43.2 percent (80 homicides) involved arguments between the victim and offender.
Ranked 9th in the United States
There were 144 Black homicide victims in Kentucky in 2024.
The homicide rate among Black victims in Kentucky was 33.0 per 100,000 in 2024. Black victims were 7.9 times more likely to die by homicide compared to white victims in the state.
Age
Fifteen homicide victims were less than 18 years old (10.4 percent). Fewer than 10 victims were age 65 or older.
Sex
Out of 144 homicide victims, 131 (91.0 percent) were male and 13 (9.0 percent) were female.
Most Common Weapons
Most victims were killed by firearms (94.4 percent or 136 out of 144). Fewer than 10 victims were killed with knives or other sharp instruments.
Victim/Offender Relationship
For homicides in which the victim to offender relationship could be identified, 84.3 percent of victims (43 out of 51) were killed by someone they knew. Fewer than 10 victims were killed by a stranger.
Circumstance
For homicides in which the circumstances could be identified, 82.4 percent (42 out of 51) were not related to the commission of any other felony. Of these, 61.9 percent (26 homicides) involved arguments between the victim and offender.
Ranked 10th in the United States
There were 148 Black homicide victims in Arkansas in 2024.
The homicide rate among Black victims in Arkansas was 30.5 per 100,000 in 2024. Black victims were 7.2 times more likely to die by homicide compared to white victims in the state.
Age
Thirteen homicide victims were less than 18 years old (8.8 percent). Fewer than 10 victims were age 65 or older.
Sex
Out of 148 homicide victims, 129 (87.2 percent) were male and 19 (12.8 percent) were female.
Most Common Weapons
Most victims were killed by firearms (89.9 percent or 133 out of 148). Fewer than 10 victims were killed with knives or other sharp instruments.
Victim/Offender Relationship
For homicides in which the victim to offender relationship could be identified, 97.9 percent of victims (47 out of 48) were killed by someone they knew. Fewer than 10 victims were killed by strangers.
Circumstance
For homicides in which the circumstances could be identified, 83.8 percent (62 out of 74) were not related to the commission of any other felony. Of these, 38.7 percent (24 homicides) involved arguments between the victim and offender.
There were 10,533 Black homicide victims in the United States in 2024.
The homicide rate among Black victims in the United States was 22.4 per 100,000 in 2024. Black victims were 6.4 times more likely to die by homicide compared to white victims.
Age
One thousand and ninety-five homicide victims were less than 18 years old (10.4 percent). Three hundred and thirty victims were age 65 or older (3.1 percent).
Sex
Out of 10,533 homicide victims, 8,982 (85.3 percent) were male and 1,551 (14.7 percent) were female.
Most Common Weapons
Most victims were killed by firearms (84.3 percent or 8,882 out of 10,533) and 617 were killed with knives or other sharp instruments (5.9 percent).
Victim/Offender Relationship
For homicides in which the victim to offender relationship could be identified, 77.0 percent of victims (2,942 out of 3,820) were killed by someone they knew. Eight hundred seventy-eight victims were killed by strangers (23.0 percent).
Circumstance
For homicides in which the circumstances could be identified, 80.9 percent (3,519 out of 4,350) were not related to the commission of any other felony. Of these, 56.1 percent (1,973 homicides) involved arguments between the victim and the offender.
Appendix Two
Number of Black homicide victims and rates by state, 202429
| State ranking by rate | State | Number of homicide deaths | Homicide rate |
|---|---|---|---|
| 1 | Missouri | 353 | 48.3 |
| 2 | Mississippi | 449 | 41.0 |
| 3 (tie) | Illinois | 708 | 38.6 |
| 3 (tie) | Wisconsin | 157 | 38.6 |
| 5 | Tennessee | 435 | 36.2 |
| 6 | Louisiana | 523 | 35.3 |
| 7 | Indiana | 263 | 35.0 |
| 8 | Alabama | 466 | 34.4 |
| 9 | Kentucky | 144 | 33.0 |
| 10 | Arkansas | 148 | 30.5 |
| 11 | Kansas | 54 | 29.7 |
| 12 | Ohio | 477 | 29.5 |
| 13 | Michigan | 370 | 27.0 |
| 14 | South Carolina | 331 | 23.9 |
| 15 | New Mexico | 15 | 23.7 |
| 16 | Pennsylvania | 383 | 23.3 |
| 17 | Oklahoma | 74 | 22.9 |
| 18 | Oregon | 27 | 22.4 |
| 19 | Maryland | 409 | 21.4 |
| 20 | Nevada | 77 | 21.3 |
| 21 (tie) | West Virginia | 16 | 21.1 |
| 21 (tie) | North Carolina | 507 | 21.1 |
| 23 | Georgia | 756 | 20.1 |
| 24 | Delaware | 49 | 19.6 |
| 25 | Minnesota | 95 | 19.3 |
| 26 | Virginia | 329 | 18.9 |
| 27 | California | 479 | 18.3 |
| 28 | Arizona | 82 | 17.9 |
| 29 | Colorado | 56 | 17.4 |
| 30 | Iowa | 28 | 17.1 |
| 31 | Texas | 750 | 17.0 |
| 32 | Florida | 609 | 15.4 |
| 33 | Nebraska | 18 | 15.3 |
| 34 | Washington | 57 | 14.2 |
| 35 | Connecticut | 56 | 11.0 |
| 36 | New Jersey | 157 | 10.6 |
| 37 | New York | 368 | 10.4 |
| 38 | Massachusetts | 52 | 7.4 |
| — | Alaska | — | — |
| — | Hawaii | — | — |
| — | Idaho | — | — |
| — | Maine | — | — |
| — | Montana | — | — |
| — | New Hampshire | — | — |
| — | North Dakota | — | — |
| — | Rhode Island | — | — |
| — | South Dakota | — | — |
| — | Utah | — | — |
| — | Vermont | — | — |
| — | Wyoming | — | — |
| U.S. Total | 10,533 | 22.4 |
— Indicates value has been suppressed because the number is too small to publish due to privacy concerns (fewer than 10 deaths). In order to ensure rankings contain stable rates, states with fewer than 10 Black homicide victims were not included in the state rankings for 2024. These victims are included in the U.S. total and rate.
Appendix Three
This appendix contains the data for the figures in the report.
Figure 1. Black percentage of United States population (left figure); Black percentage of homicide victims (right figure), 202430
| Percentage of U.S. population | Percentage of homicides | |
|---|---|---|
| Black | 13.7% | 52.2% |
| Rest of population | 86.3% | 47.8% |
Figure 2. Homicide and firearm homicide victimization rates by race, 2018 — 202431
| Black homicide | Black firearm homicide | White homicide | White firearm homicide | American Indian/Alaska Native homicide | American Indian/Alaska Native firearm homicide | Asian homicide | Asian firearm homicide | |
|---|---|---|---|---|---|---|---|---|
| 2018 | 21.2 | 17.6 | 3.4 | 2.3 | 7.2 | 4.1 | 1.5 | 1.0 |
| 2019 | 22.1 | 18.6 | 3.3 | 2.2 | 7.4 | 4.0 | 1.7 | 1.0 |
| 2020 | 29.6 | 25.9 | 4.1 | 2.8 | 8.7 | 4.8 | 1.6 | 1.0 |
| 2021 | 31.6 | 28.0 | 4.3 | 3.1 | 8.4 | 5.3 | 1.7 | 1.2 |
| 2022 | 29.1 | 25.4 | 4.2 | 3.0 | 10.0 | 6.1 | 1.7 | 1.1 |
| 2023 | 26.4 | 22.7 | 3.8 | 2.8 | 8.7 | 5.4 | 1.7 | 1.1 |
| 2024 | 22.4 | 18.9 | 3.5 | 2.4 | 7.8 | 4.5 | 1.4 | 0.8 |
Figure 3. Homicide and firearm homicide victimization rates among males by race, 2018 — 202432
| Black males – homicide | White males – homicide | Black males – firearm homicide | White males – firearm homicide | |
|---|---|---|---|---|
| 2018 | 36.8 | 4.9 | 31.7 | 3.4 |
| 2019 | 39.0 | 4.8 | 33.9 | 3.4 |
| 2020 | 52.3 | 6.0 | 46.6 | 4.4 |
| 2021 | 55.2 | 6.4 | 49.7 | 4.8 |
| 2022 | 50.9 | 6.2 | 45.2 | 4.6 |
| 2023 | 45.7 | 5.7 | 40.1 | 4.2 |
| 2024 | 39.0 | 5.1 | 33.5 | 3.7 |
Figure 4. Homicide and firearm homicide victimization rates among females by race, 2018 — 202433
| Black females – homicide | White females – homicide | Black females – firearm homicide | White females – firearm homicide | |
|---|---|---|---|---|
| 2018 | 6.2 | 1.9 | 4.1 | 1.0 |
| 2019 | 5.9 | 1.8 | 3.9 | 1.0 |
| 2020 | 7.8 | 2.1 | 5.8 | 1.2 |
| 2021 | 8.9 | 2.1 | 7.0 | 1.3 |
| 2022 | 8.2 | 2.1 | 6.2 | 1.3 |
| 2023 | 7.7 | 1.9 | 5.7 | 1.2 |
| 2024 | 6.5 | 1.8 | 4.8 | 1.1 |
Figure 5. Male homicide victimization age by race, 202434
| Black male | White male | |
|---|---|---|
| Under 18 | 9.8% | 8.0% |
| 65+ | 2.8% | 8.5% |
Figure 6. Female homicide victimization age by race, 202435
| Black female | White female | |
|---|---|---|
| Under 18 | 13.9% | 9.2% |
| 65+ | 5.0% | 18.6% |
Figure 7. Weapons used — Black victims (left figure); white victims (right figure), 202436
| Black victims (left figure) | White victims (right figure) | |
|---|---|---|
| Firearm | 84.3% | 67.8% |
| Knife or other sharp instrument | 5.9% | 10.9% |
| Suffocation | 1.1% | 3.1% |
| Other | 8.7% | 18.2% |
Figure 8. Black homicide victimization rates in Missouri and the United States, 2003 — 202437
| Missouri | National | |
|---|---|---|
| 2003 | 24.4 | 21.0 |
| 2004 | 29.2 | 20.1 |
| 2005 | 32.3 | 21.1 |
| 2006 | 35.0 | 21.5 |
| 2007 | 30.1 | 20.9 |
| 2008 | 39.4 | 19.3 |
| 2009 | 33.7 | 18.1 |
| 2010 | 34.8 | 17.7 |
| 2011 | 32.8 | 17.5 |
| 2012 | 33.3 | 18.2 |
| 2013 | 30.7 | 17.6 |
| 2014 | 34.0 | 17.1 |
| 2015 | 45.1 | 19.5 |
| 2016 | 44.3 | 21.2 |
| 2017 | 54.1 | 21.2 |
| 2018 | 53.6 | 21.2 |
| 2019 | 58.3 | 22.1 |
| 2020 | 71.9 | 29.6 |
| 2021 | 64.8 | 31.6 |
| 2022 | 65.9 | 29.1 |
| 2023 | 54.7 | 26.4 |
| 2024 | 48.3 | 22.4 |
Figure 9. Comparison of Black and white homicide victimization rates by state, ranked by Black victimization homicide rate, 202438
| Black homicide rate | White homicide rate | |
|---|---|---|
| Missouri | 48.3 | 3.8 |
| Mississippi | 41.0 | 5.6 |
| Illinois | 38.6 | 3.7 |
| Wisconsin | 38.6 | 2.1 |
| Tennessee | 36.2 | 4.6 |
| Louisiana | 35.3 | 4.5 |
| Indiana | 35.0 | 3.9 |
| Alabama | 34.4 | 5.1 |
| Kentucky | 33.0 | 4.2 |
| Arkansas | 30.5 | 4.2 |
| Kansas | 29.7 | 3.9 |
| Ohio | 29.5 | 2.7 |
| Michigan | 27.0 | 2.0 |
| South Carolina | 23.9 | 4.7 |
| New Mexico | 23.7 | 12.9 |
| Pennsylvania | 23.3 | 2.8 |
| Oklahoma | 22.9 | 4.8 |
| U.S. | 22.4 | 3.5 |
| Oregon | 22.4 | 3.4 |
| Maryland | 21.4 | 3.2 |
| Nevada | 21.3 | 5.6 |
| West Virginia | 21.1 | 5.1 |
| North Carolina | 21.1 | 3.7 |
| Georgia | 20.1 | 3.6 |
| Delaware | 19.6 | 2.2 |
| Minnesota | 19.3 | 1.6 |
| Virginia | 18.9 | 2.2 |
| California | 18.3 | 4.1 |
| Arizona | 17.9 | 4.9 |
| Colorado | 17.4 | 4.6 |
| Iowa | 17.1 | 2.8 |
| Texas | 17.0 | 4.5 |
| Florida | 15.4 | 3.2 |
| Nebraska | 15.3 | 2.2 |
| Washington | 14.2 | 3.9 |
| Connecticut | 11.0 | 1.7 |
| New Jersey | 10.6 | 1.6 |
| New York | 10.4 | 2.2 |
| Massachusetts | 7.4 | 1.8 |
| Alaska | — | 3.6 |
| Wyoming | — | 3.4 |
| South Dakota | — | 3.2 |
| Vermont | — | 3.1 |
| Maine | — | 2.7 |
| Montana | — | 2.3 |
| Utah | — | 1.8 |
| Idaho | — | 1.6 |
| Rhode Island | — | 1.6 |
| New Hampshire | — | 1.4 |
| Hawaii | — | — |
| North Dakota | — | — |
— Indicates value has been suppressed because the number is too small to calculate stable rates (fewer than 10 deaths).
Figure 10. Ratio illustrating the difference between Black and white homicide victimization rates by state, 202439
| State | Black homicide rate | White homicide rate | Black/White homicide rate ratio |
|---|---|---|---|
| Wisconsin | 38.6 | 2.1 | 18.8 |
| Michigan | 27.0 | 2.0 | 13.6 |
| Missouri | 48.3 | 3.8 | 12.7 |
| Minnesota | 19.3 | 1.6 | 12.2 |
| Ohio | 29.5 | 2.7 | 10.8 |
| Illinois | 38.6 | 3.7 | 10.5 |
| Indiana | 35.0 | 3.9 | 9.0 |
| Delaware | 19.6 | 2.2 | 8.8 |
| Virginia | 18.9 | 2.2 | 8.5 |
| Pennsylvania | 23.3 | 2.8 | 8.3 |
| Tennessee | 36.2 | 4.6 | 7.9 |
| Louisiana | 35.3 | 4.5 | 7.9 |
| Kentucky | 33.0 | 4.2 | 7.9 |
| Kansas | 29.7 | 3.9 | 7.6 |
| Mississippi | 41.0 | 5.6 | 7.3 |
| Arkansas | 30.5 | 4.2 | 7.2 |
| Nebraska | 15.3 | 2.2 | 7.0 |
| Alabama | 34.4 | 5.1 | 6.8 |
| Maryland | 21.4 | 3.2 | 6.7 |
| Oregon | 22.4 | 3.4 | 6.6 |
| New Jersey | 10.6 | 1.6 | 6.6 |
| U.S. | 22.4 | 3.5 | 6.4 |
| Connecticut | 11.0 | 1.7 | 6.3 |
| Iowa | 17.1 | 2.8 | 6.2 |
| North Carolina | 21.1 | 3.7 | 5.7 |
| Georgia | 20.1 | 3.6 | 5.6 |
| South Carolina | 23.9 | 4.7 | 5.1 |
| Oklahoma | 22.9 | 4.8 | 4.8 |
| Florida | 15.4 | 3.2 | 4.8 |
| New York | 10.4 | 2.2 | 4.7 |
| California | 18.3 | 4.1 | 4.4 |
| West Virginia | 21.1 | 5.1 | 4.2 |
| Massachusetts | 7.4 | 1.8 | 4.0 |
| Nevada | 21.3 | 5.6 | 3.8 |
| Colorado | 17.4 | 4.6 | 3.8 |
| Texas | 17.0 | 4.5 | 3.8 |
| Arizona | 17.9 | 4.9 | 3.7 |
| Washington | 14.2 | 3.9 | 3.6 |
| New Mexico | 23.7 | 12.9 | 1.8 |
| Alaska | — | 3.6 | — |
| Wyoming | — | 3.4 | — |
| South Dakota | — | 3.2 | — |
| Vermont | — | 3.1 | — |
| Maine | — | 2.7 | — |
| Montana | — | 2.3 | — |
| Utah | — | 1.8 | — |
| Idaho | — | 1.6 | — |
| Rhode Island | — | 1.6 | — |
| New Hampshire | — | 1.4 | — |
| Hawaii | — | — | — |
| North Dakota | — | — | — |
— Indicates value has been suppressed because the number is too small to calculate stable rates (fewer than 10 deaths).
Copyright and Acknowledgments
Copyright © July 2026 Violence Policy Center
The Violence Policy Center (VPC) is a national nonprofit educational organization that conducts research and public education on violence in America and provides information and analysis to policymakers, journalists, advocates, and the general public.
This study was supported in part by a generous gift from Ellen Berman.
This study was authored by VPC Public Health Analyst Terra Wiens, MPH.
For a complete list of VPC publications with document links, please click here.
To learn more about the Violence Policy Center, please click here.
To make a tax-deductible contribution to help support our work, please click here.
Endnotes
- Light MT, Vachuska K. Increased homicide played a key role in driving Black-White disparities in life expectancy among men during the COVID-19 pandemic. PLoS ONE. 2024;19(8): e0308105.
- Knorre A, MacDonald J. Unequal by the gun: Four decades of the Black-White firearm homicide gap. PLoS One. 2026;21(2): e0341645.
- Victim race data presented in this study include both Hispanic and non-Hispanic ethnicities.
- All rates presented in this study are per 100,000 and adjusted for age.
- CDC WISQARS Fatal and Nonfatal Injury Reports. Accessed April 2026. Available at: https://wisqars.cdc.gov/reports.
- The category “Asian” in this report includes Native Hawaiians and Pacific Islanders.
- CDC WISQARS Fatal and Nonfatal Injury Reports. Accessed April 2026. Available at: https://wisqars.cdc.gov/reports.
- CDC WISQARS Fatal and Nonfatal Injury Reports. Accessed April 2026. Available at: https://wisqars.cdc.gov/reports.
- CDC WISQARS Leading Causes of Death. Accessed April 2026. Available at: https://wisqars.cdc.gov/lcd/?o=LCD&y1=2024&y2=2024&ct=10&cc=ALL&g=00&s=0&r=0&ry=2&e=0&ar=lcd1age&at=groups&ag=lcd1age&a1=0&a2=199.
- CDC WISQARS Fatal and Nonfatal Injury Reports. Accessed April 2026. Available at: https://wisqars.cdc.gov/reports.
- CDC WISQARS Fatal and Nonfatal Injury Reports. Accessed April 2026. Available at: https://wisqars.cdc.gov/reports.
- CDC WISQARS Fatal and Nonfatal Injury Reports. Accessed April 2026. Available at: https://wisqars.cdc.gov/reports.
- CDC WISQARS Fatal and Nonfatal Injury Reports. Accessed April 2026. Available at: https://wisqars.cdc.gov/reports.
- CDC WISQARS Fatal and Nonfatal Injury Reports. Accessed April 2026. Available at: https://wisqars.cdc.gov/reports.
- CDC WISQARS Fatal and Nonfatal Injury Reports. Accessed April 2026. Available at: https://wisqars.cdc.gov/reports.
- Prior editions of this report published in 2023 and earlier used FBI crime data for state rankings; therefore, the state rankings in this report are not directly comparable to rankings published in reports from 2023 and earlier. Any comparisons with previous years should note this transition in data sources (FBI crime data to CDC mortality data).
- CDC WISQARS Fatal and Nonfatal Injury Reports. Accessed April 2026. Available at: https://wisqars.cdc.gov/reports.
- CDC WISQARS Fatal and Nonfatal Injury Reports. Accessed April 2026. Available at: https://wisqars.cdc.gov/reports.
- This ratio is calculated by dividing the black homicide victimization rate by the white homicide victimization rate for each state.
- CDC WISQARS Fatal and Nonfatal Injury Reports. Accessed April 2026. Available at: https://wisqars.cdc.gov/reports.
- FBI Supplementary Homicide Report data. Downloaded from the Crime Data Explorer on March 15, 2026. Available at: https://cde.ucr.cjis.gov/LATEST/webapp/#/pages/home.
- FBI Supplementary Homicide Report data. Downloaded from the Crime Data Explorer on March 15, 2026. Available at: https://cde.ucr.cjis.gov/LATEST/webapp/#/pages/home.
- In January 2019, the FBI began collecting data on violent police encounters in the National Use-of-Force Data Collection database. Limited use-of-force data are currently available online. According to the FBI, 12,289 out of 19,277 federal, state, local, and tribal law enforcement agencies throughout the nation participated and provided use of force data in 2024. The officers employed by these agencies represent 80 percent of federal, state, local, and tribal sworn officers in the nation. Agency participation decreased to 11,964 agencies in 2026, representing 76 percent of sworn officers in the nation. Source: Federal Bureau of Investigation, Crime Data Explorer, Law Enforcement Collections. Accessed June 25, 2026. Available at: https://cde.ucr.cjis.gov/LATEST/webapp/#/pages/le/uof.
- CDC WISQARS Fatal and Nonfatal Injury Reports. Accessed April 2026. Available at: https://wisqars.cdc.gov/reports.
- For more information, see the Violence Policy Center studies How the Firearms Industry and NRA Market Guns to Black and Latino Americans, January 2021 (https://gunindustryaccountability.org/issue/how-the-firearms-industry-and-nra-market-guns-to-communities-of-color/) and How the Firearms Industry Markets Guns to Asian Americans, September 2021, (https://gunindustryaccountability.org/issue/how-the-firearms-industry-markets-guns-to-asian-americans/).
- For more information on trauma and community violence, see the July 2017 Violence Policy Center study The Relationship Between Community Violence and Trauma: How Violence Affects Learning, Health, and Behavior (https://www.vpc.org/studies/trauma17.pdf).
- CDC WISQARS Fatal and Nonfatal Injury Reports. Accessed April 2026. Available at: https://wisqars.cdc.gov/reports.
- FBI Supplementary Homicide Report data. Downloaded from the Crime Data Explorer on March 15, 2026. Available at: https://cde.ucr.cjis.gov/LATEST/webapp/#/pages/home.
- CDC WISQARS Fatal and Nonfatal Injury Reports. Accessed April 2026. Available at: https://wisqars.cdc.gov/reports.
- CDC WISQARS Fatal and Nonfatal Injury Reports. Accessed April 2026. Available at: https://wisqars.cdc.gov/reports.
- CDC WISQARS Fatal and Nonfatal Injury Reports. Accessed April 2026. Available at: https://wisqars.cdc.gov/reports.
- CDC WISQARS Fatal and Nonfatal Injury Reports. Accessed April 2026. Available at: https://wisqars.cdc.gov/reports.
- CDC WISQARS Fatal and Nonfatal Injury Reports. Accessed April 2026. Available at: https://wisqars.cdc.gov/reports.
- CDC WISQARS Fatal and Nonfatal Injury Reports. Accessed April 2026. Available at: https://wisqars.cdc.gov/reports.
- CDC WISQARS Fatal and Nonfatal Injury Reports. Accessed April 2026. Available at: https://wisqars.cdc.gov/reports.
- CDC WISQARS Fatal and Nonfatal Injury Reports. Accessed April 2026. Available at: https://wisqars.cdc.gov/reports.
- CDC WISQARS Fatal and Nonfatal Injury Reports. Accessed April 2026. Available at: https://wisqars.cdc.gov/reports.
- CDC WISQARS Fatal and Nonfatal Injury Reports. Accessed April 2026. Available at: https://wisqars.cdc.gov/reports.
- CDC WISQARS Fatal and Nonfatal Injury Reports. Accessed April 2026. Available at: https://wisqars.cdc.gov/reports.