Suicide is a tragedy that affects innumerable families and communities every year in the United States. While the devastating impact suicide has on loved ones and communities is impossible to truly measure, this study describes the number of suicide and gun suicide deaths in the United States, as well as recent trends in these deaths by age, sex, and race.
If you need help or are worried about someone else, please call or text 988.
You can also visit 988lifeline.org for help.
The mortality data used for this study are from 2024 and come from the Centers for Disease Control and Prevention’s (CDC) Web-based Injury Statistics Query and Reporting System (WISQARS). They are the most recent and complete year of information available.1
In 2024 there were 48,824 suicides in the United States. Of these, the majority (27,593 or 56.5 percent) were firearm suicides. In 2023 there were 49,316 suicides in the United States, of these 27,300 (55.4 percent) were firearm suicides.
Any discussion of suicide must recognize the commonality and lethality of gun use in these acts. More than half of suicide deaths occur by firearm every year, and in 2024 nearly two out of every three gun deaths was a gun suicide. Multiple studies have shown that access to a firearm increases an individual’s risk of gun suicide, 2 3 4 5 which in turn results in higher overall suicide rates. This is due at least in part to the inherent lethality of firearms. According to one study, between 2007 and 2014 less than nine percent of all suicide attempts in the United States were fatal, while 90 percent of all attempts with a gun were fatal.6
Suicide by State
States with the Highest and Lowest Suicide Rates
States with lower rates of gun ownership and stronger7 gun violence prevention laws have the lowest overall suicide rates in the nation. Conversely, states with the highest suicide rates have higher gun ownership rates and weaker gun violence prevention laws. The tables below list the states with the five highest and five lowest highest overall suicide rates8 in 2024. Appendix One contains data for all 50 states ranked by each state’s overall suicide rate.
The state with the highest overall suicide rate in the nation in 2024 was Alaska with a suicide rate of 29.8 per 100,000 residents and a gun suicide rate of 18.8 per 100,000 residents. Wyoming ranked second with a suicide rate of 27.8 per 100,000 residents and a gun suicide rate of 19.7 per 100,000 residents. Montana ranked third with 26.8 suicides per 100,000 residents and 16.9 gun suicides per 100,000 residents. New Mexico ranked fourth with 24.4 suicides per 100,000 residents and 14.2 gun suicides per 100,000 residents. South Dakota ranked fifth with 22.0 suicides per 100,000 residents and 12.5 gun suicides per 100,000 residents.
In each of these five states guns were used in 59 percent or more of the suicides reported that year and all had a household gun ownership rate above 46 percent. Compared to the states with the lowest suicide rates, each of these states has weak gun violence prevention laws.
Table 1. States with the highest suicide rates ranked by overall suicide rate, 20249
| Rank | State | Overall Suicide Rate per 100,000 | Gun Suicide Rate per 100,000 | Overall Number of Suicides | Number of Gun Suicides | Percent of Suicides Involving Guns | Household Gun Ownership in State10 |
|---|---|---|---|---|---|---|---|
| 1 | Alaska | 29.8 | 18.8 | 222 | 141 | 63.5% | 64.5% |
| 2 | Wyoming | 27.8 | 19.7 | 169 | 123 | 72.8% | 66.2% |
| 3 | Montana | 26.8 | 16.9 | 320 | 212 | 66.3% | 66.3% |
| 4 | New Mexico | 24.4 | 14.2 | 532 | 317 | 59.6% | 46.2% |
| 5 | South Dakota | 22.0 | 12.5 | 198 | 117 | 59.1% | 55.3% |
The state with the lowest overall suicide rate in 2024 was New Jersey with a suicide rate of 6.7 per 100,000 residents and a gun suicide rate of 2.1 per 100,000 residents. New York ranked second lowest with a suicide rate of 8.1 per 100,000 residents and a gun suicide rate of 2.3 per 100,000 residents. Massachusetts ranked third lowest with 8.3 suicides per 100,000 residents and 2.3 gun suicides per 100,000 residents. Rhode Island ranked fourth lowest with 8.9 suicides per 100,000 residents and 3.3 gun suicides per 100,000 residents. California ranked fifth lowest with 9.6 suicides per 100,000 residents and 3.5 gun suicides per 100,000 residents.
In each of these five states guns were used in 40 percent or less of the suicides reported that year and all had a household gun ownership rate below 29 percent. Compared to the five states with the highest suicide rates, each of these states has stronger gun violence prevention laws.
Table 2. States with the lowest suicide rates ranked by overall suicide rate, 202411
| Rank | State | Overall Suicide Rate per 100,000 | Gun Suicide Rate per 100,000 | Overall Number of Suicides | Number of Gun Suicides | Percent of Suicides Involving Guns | Household Gun Ownership in State12 |
|---|---|---|---|---|---|---|---|
| 50 | New Jersey | 6.7 | 2.1 | 682 | 222 | 32.6% | 14.7% |
| 49 | New York | 8.1 | 2.3 | 1,701 | 503 | 29.6% | 19.9% |
| 48 | Massachusetts | 8.3 | 2.3 | 648 | 184 | 28.4% | 14.7% |
| 47 | Rhode Island | 8.9 | 3.3 | 105 | 42 | 40.0% | 14.8% |
| 46 | California | 9.6 | 3.5 | 4,022 | 1,530 | 38.0% | 28.3% |
Guns are the most lethal means of suicide and access to guns increases an individual’s risk of gun suicide. Year after year, suicide mortality data show that states with higher percentages of gun ownership and less restrictive gun laws have higher rates of suicide and gun suicide, demonstrating that guns are the driving factor for overall suicide rates.
Suicide Trends
Contrary to popular perception, most gun deaths in the Unites States are suicides, not homicides. In 2024, guns claimed 44,447 American lives. Of these, 27,593 (62.1 percent) were suicides and 15,364 (34.6 percent) were homicides.
The overall suicide rate decreased slightly between 2022 and 2024, from 14.2 per 100,000 in 2022 to 13.7 per 100,000 in 2024 (Figure 1). The firearm suicide rate, however, has increased since 2019: from 6.8 per 100,000 in 2019 to 7.6 per 100,000 in 2022. The rate has remained stable at 7.6 per 100,000 since 2022. In contrast, both overall homicide and gun homicide rates have been decreasing since 2021.
Figure 1. Death rates, 2018 — 202413
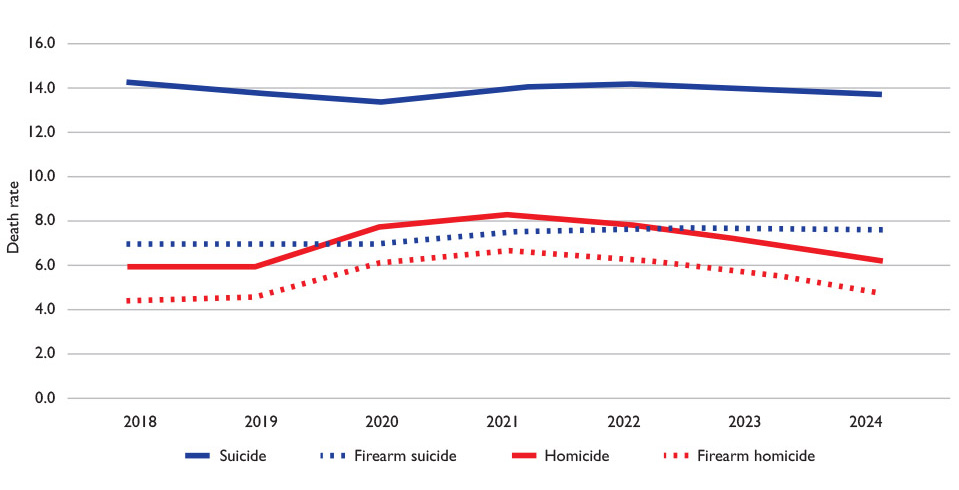
Though the percentage of suicides due to guns remained stable between 2004 to 2019, this percentage increased from 50.4 percent in 2019 to 56.5 percent in 2024 (Figure 2).
Figure 2. Percentage of suicides involving a gun, 2004 — 202414

Suicide and firearm suicide trends vary by sex and race
Males consistently have higher suicide and gun suicide rates than females. In 2024, males died by suicide at rates four times higher than females (22.2 per 100,000 and 5.6 per 100,000, respectively) (Figure 3). Males are nearly seven times as likely to die by gun suicide compared to females — in 2024 the gun suicide rate among males was 13.5 per 100,000 compared to 2.0 per 100,000 among females.
Figure 3. Suicide and gun suicide rates by sex, 2018 — 202415
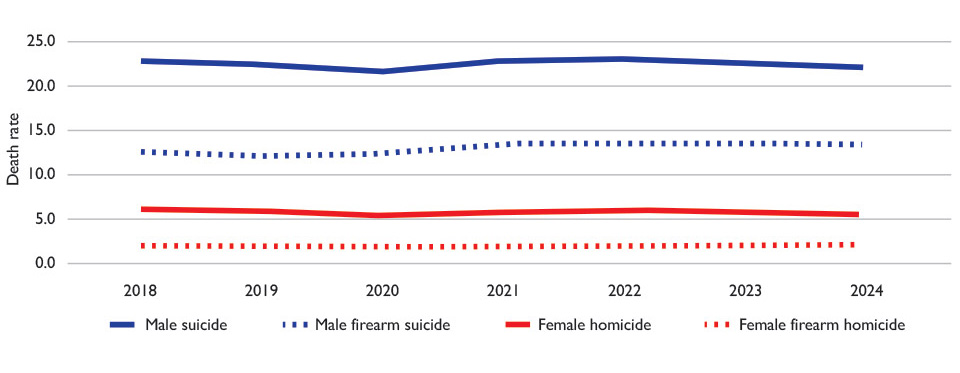
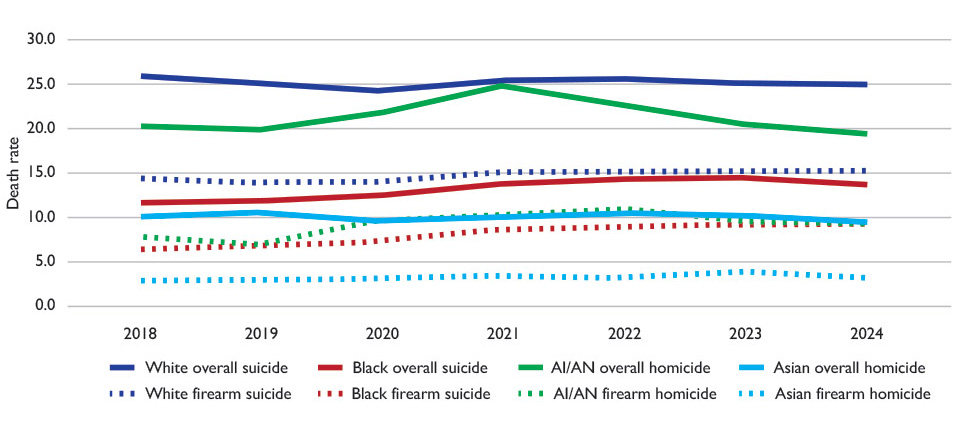
White males consistently have the highest suicide and firearm suicide rates compared to males of other races (24.8 per 100,000 and 15.1 per 100,000, respectively)
(Figure 4),16 and American Indian/Alaska Native (AI/AN) males experience the second highest suicide and firearm suicide rates (19.5 per 100,000 and 9.2 per 100,000, respectively). Suicide rates among AI/AN males increased substantially during the COVID-19 pandemic, from 19.9 per 100,000 in 2019 to 24.9 per 100,000 in 2021, before steadily decreasing to 19.5 per 100,000 in 2024. Among Black males, both suicide and gun suicide rates have been increasing since 2018. Suicide rates increased from 11.7 per 100,000 to 14.5 per 100,000 in 2023 before decreasing to 13.9 per 100,000 in 2024. Gun suicide rates increased from 6.4 per 100,000 in 2018 to 9.2 per 100,000 in 2023 before decreasing slightly to 9.1 per 100,000 in 2024.
Figure 4. Suicide and firearm suicide rates among males by race,17 2018 — 202418
In 2024 AI/AN females had the highest suicide rates compared to females of other races (6.4 per 100,000), followed closely by white females (6.2 per 100,000) (Figure 5). White females consistently have the highest gun suicide rates, followed by AI/AN females — in 2024 the gun suicide rate among white females was 2.3 per 100,000 and 1.5 per 100,000 among AI/AN females. Similar to AI/AN males, suicide rates among AI/AN females increased substantially during the COVID-19 pandemic — from 7.2 per 100,000 in 2020 to 8.8 per 100,000 in 2022, before steadily decreasing to 6.4 per 100,000 in 2024. The suicide and gun suicide rates among Black females have increased slightly since 2020 — the suicide rate increased from 2.8 per 100,000 in 2020 to 3.4 per 100,000 in 2023, while the gun suicide rate increased from 0.8 per 100,000 in 2020 to 1.3 per 100,000 in 2022. This rate remained stable between 2022 and 2024.
Figure 5. Suicide and firearm suicide rates among females by race, 2018 — 202419
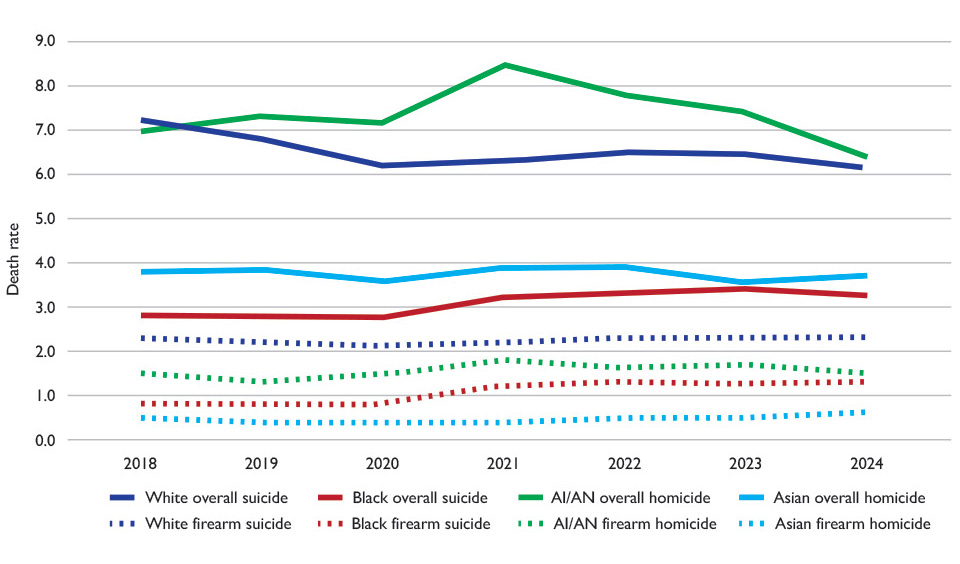
Suicide and firearm suicide trends among the young and the old
Among all individuals age 24 and younger, the AI/AN population has the highest suicide rate, though it decreased from 12.3 per 100,000 in 2021 to 8.3 per 100,000 in 2024 (Figure 6). In 2024, AI/AN youth and young adults had the highest gun suicide rate at 4.4 per 100,000, followed by Black youth and young adults at 4.0 per 100,000.
Figure 6. Suicide and firearm suicide rates* among victims age 24 and younger, 2018 — 202420
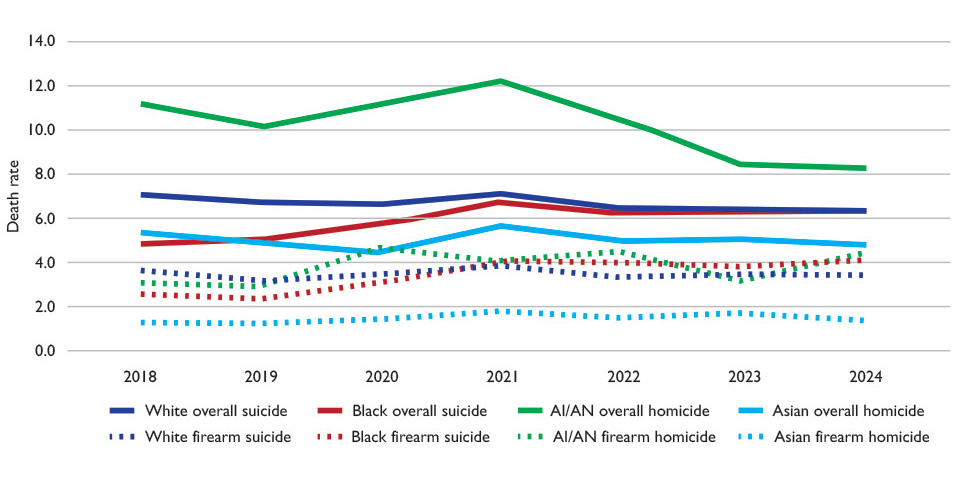
*The rates presented in Figures 6 and 7 are not adjusted for age.
Older white Americans have the highest suicide and firearm suicide rates compared to older Americans of all other races (Figure 7). In 2024, white Americans age 55 and older died by suicide at a rate of 20.4 per 100,000 — 2.7 times higher than older AI/AN and Asian populations (both 7.5 per 100,000).
Figure 7. Suicide and firearm suicide rates* among victims age 55 and older, 2018 — 202421
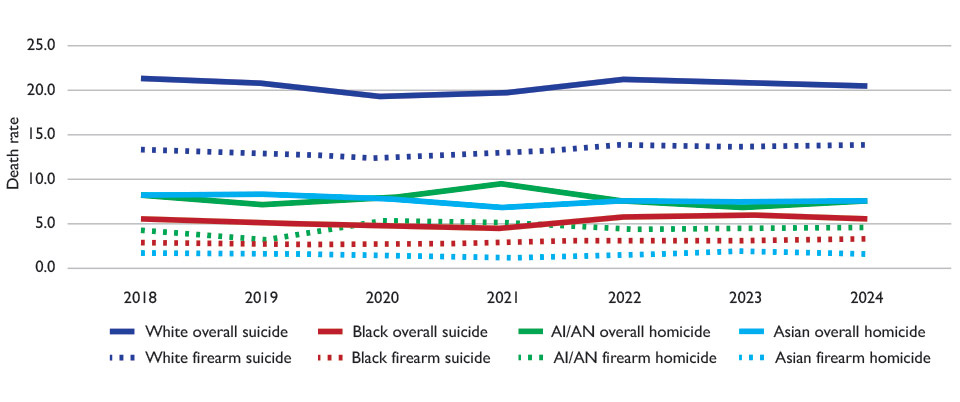
*The rates presented in Figures 6 and 7 are not adjusted for age.
Conclusion
Suicide affects all Americans, albeit in different ways. While white males and older white Americans consistently have higher suicide and gun suicide rates, both suicide and gun suicide rates have increased among Black Americans in recent years. Among those ages 24 and younger, AI/AN Americans have the highest suicide and gun suicide rates. The AI/AN population experienced a peak in overall suicide rates in 2021 among both males and females as well as the young and old.
Guns are the most common suicide means in the nation, consistently comprising more than half of all suicides every year. It is therefore not surprising that states with weaker gun violence prevention laws and higher rates of firearm ownership have the highest suicide rates, while states with stricter gun laws and lower gun ownership rates consistently have the lowest rates of suicide. Year after year, mortality data show that reducing access to guns is a critical element of suicide prevention.
Appendix One: State Suicide Rates
State suicide and gun suicide rates, ranked by overall suicide rate, 202422
| Rank | State | Overall Suicide Rate per 100,000 | Gun Suicide Rate per 100,000 | Overall Number of Suicides | Number of Gun Suicides | Percentage of Suicides Involving Guns | Household Gun Ownership in State |
|---|---|---|---|---|---|---|---|
| 1 | Alaska | 29.8 | 18.8 | 222 | 141 | 63.5% | 64.5% |
| 2 | Wyoming | 27.8 | 19.7 | 169 | 123 | 72.8% | 66.2% |
| 3 | Montana | 26.8 | 16.9 | 320 | 212 | 66.3% | 66.3% |
| 4 | New Mexico | 24.4 | 14.2 | 532 | 317 | 59.6% | 46.2% |
| 5 | South Dakota | 22.0 | 12.5 | 198 | 117 | 59.1% | 55.3% |
| 6 | Idaho | 21.2 | 13.7 | 437 | 286 | 65.4% | 60.1% |
| 7 | Oklahoma | 20.9 | 13.1 | 868 | 560 | 64.5% | 54.7% |
| 8 | Colorado | 20.8 | 11.1 | 1,313 | 712 | 54.2% | 45.1% |
| 9 | Oregon | 19.9 | 10.8 | 941 | 524 | 55.7% | 50.8% |
| 10 | Nevada | 19.6 | 11.4 | 676 | 402 | 59.5% | 47.3% |
| 11 | Utah | 19.5 | 11.1 | 665 | 378 | 56.8% | 46.8% |
| 12 | North Dakota | 19.3 | 10.6 | 145 | 81 | 55.9% | 55.1% |
| 13 | Maine | 19.0 | 10.0 | 285 | 157 | 55.1% | 46.8% |
| 14 | Arkansas | 18.9 | 12.4 | 592 | 402 | 67.9% | 57.2% |
| 18 | Arizona | 18.8 | 11.2 | 1,516 | 933 | 61.5% | 46.3% |
| 16 | Kentucky | 18.0 | 11.9 | 844 | 572 | 67.8% | 54.6% |
| 17 | Kansas | 17.9 | 10.5 | 527 | 316 | 60.0% | 48.9% |
| 18 | Missouri | 17.8 | 11.0 | 1,152 | 730 | 63.4% | 48.8% |
| 19 | Iowa | 17.1 | 9.5 | 548 | 318 | 58.0% | 43.6% |
| 20 | Indiana | 16.7 | 10.6 | 1,175 | 768 | 65.4% | 44.8% |
| 21 | West Virginia | 16.5 | 10.5 | 303 | 203 | 67.0% | 58.5% |
| 22 | Tennessee | 16.4 | 10.7 | 1,229 | 816 | 66.4% | 51.6% |
| 23 | New Hampshire | 16.3 | 8.6 | 248 | 133 | 53.6% | 41.1% |
| 24 (tie) | South Carolina | 16.0 | 10.6 | 904 | 612 | 67.7% | 49.4% |
| 24 (tie) | Alabama | 16.0 | 11.5 | 837 | 622 | 74.3% | 55.5% |
| 26 | Ohio | 15.2 | 8.9 | 1,856 | 1,115 | 60.1% | 40.0% |
| 27 | Mississippi | 15.1 | 10.1 | 450 | 313 | 69.6% | 55.8% |
| 28 | Nebraska | 14.9 | 8.4 | 297 | 170 | 57.2% | 45.2% |
| 29 | Wisconsin | 14.8 | 8.0 | 920 | 507 | 55.1% | 45.3% |
| 30 | Vermont | 14.6 | 7.9 | 105 | 61 | 58.1% | 50.5% |
| 31 | Washington | 14.5 | 7.5 | 1,221 | 647 | 53.0% | 42.1% |
| 32 | Georgia | 14.3 | 9.5 | 1,648 | 1,112 | 67.5% | 49.2% |
| 33 | Texas | 14.2 | 8.8 | 4,490 | 2,779 | 61.9% | 45.7% |
| 34 | North Carolina | 14.1 | 9.0 | 1,620 | 1,059 | 65.4% | 45.8% |
| 35 | Louisiana | 14.0 | 9.2 | 654 | 443 | 67.7% | 53.1% |
| 36 (tie) | Florida | 13.8 | 8.1 | 3,633 | 2,228 | 61.3% | 35.3% |
| 36 (tie) | Minnesota | 13.8 | 6.8 | 818 | 417 | 51.0% | 42.8% |
| 38 (tie) | Hawaii | 13.7 | 1.9 | 200 | 31 | 15.5% | 14.9% |
| 38 (tie) | Michigan | 13.7 | 7.4 | 1,448 | 801 | 55.3% | 40.2% |
| 40 | Pennsylvania | 13.3 | 7.4 | 1,845 | 1,079 | 58.5% | 40.7% |
| 41 | Virginia | 12.8 | 7.7 | 1,196 | 729 | 61.0% | 44.6% |
| 42 | Delaware | 11.8 | 6.2 | 125 | 71 | 56.8% | 34.4% |
| 43 | Illinois | 10.8 | 4.8 | 1,426 | 651 | 45.7% | 27.8% |
| 44 | Connecticut | 9.9 | 3.6 | 394 | 149 | 37.8% | 23.6% |
| 45 | Maryland | 9.7 | 4.5 | 630 | 302 | 47.9% | 30.2% |
| 46 | California | 9.6 | 3.5 | 4,022 | 1,530 | 38.0% | 28.3% |
| 47 | Rhode Island | 8.9 | 3.3 | 105 | 42 | 40.0% | 14.8% |
| 48 | Massachusetts | 8.3 | 2.3 | 648 | 184 | 28.4% | 14.7% |
| 49 | New York | 8.1 | 2.3 | 1,701 | 503 | 29.6% | 19.9% |
| 50 | New Jersey | 6.7 | 2.1 | 682 | 222 | 32.6% | 14.7% |
Note: All rates are per 100,000 and adjusted for age.
Appendix Two: Data for Figures in Report
Figure 1. Death rates, 2018 — 202423
| Suicide | Homicide | Firearm suicide | Firearm homicide | |
|---|---|---|---|---|
| 2018 | 14.2 | 5.9 | 7.0 | 4.4 |
| 2019 | 13.9 | 6.0 | 6.8 | 4.6 |
| 2020 | 13.4 | 7.7 | 6.9 | 6.1 |
| 2021 | 14.0 | 8.2 | 7.5 | 6.6 |
| 2022 | 14.2 | 7.8 | 7.6 | 6.2 |
| 2023 | 14.0 | 7.0 | 7.6 | 5.6 |
| 2024 | 13.7 | 6.2 | 7.6 | 4.7 |
Figure 2. Percentage of suicides that are gun suicides, 2004 — 202424
| Percent of suicides that are firearm suicides | |
|---|---|
| 2004 | 51.6% |
| 2005 | 52.1% |
| 2006 | 50.7% |
| 2007 | 50.2% |
| 2008 | 50.6% |
| 2009 | 50.8% |
| 2010 | 50.5% |
| 2011 | 50.6% |
| 2012 | 50.9% |
| 2013 | 51.5% |
| 2014 | 49.9% |
| 2015 | 49.8% |
| 2016 | 51.0% |
| 2017 | 50.6% |
| 2018 | 50.5% |
| 2019 | 50.4% |
| 2020 | 52.8% |
| 2021 | 54.6% |
| 2022 | 54.6% |
| 2023 | 55.4% |
| 2024 | 56.5% |
Figure 3. Suicide and gun suicide rates by sex, 2018 — 202425
| Male suicide | Female suicide | Male firearm suicide | Female firearm suicide | |
|---|---|---|---|---|
| 2018 | 22.8 | 6.2 | 12.6 | 1.9 |
| 2019 | 22.3 | 6.0 | 12.2 | 1.9 |
| 2020 | 21.8 | 5.5 | 12.4 | 1.8 |
| 2021 | 22.8 | 5.7 | 13.4 | 2.0 |
| 2022 | 23.0 | 5.9 | 13.6 | 2.0 |
| 2023 | 22.6 | 5.8 | 13.5 | 2.0 |
| 2024 | 22.2 | 5.6 | 13.5 | 2.0 |
Figure 4. Suicide and firearm suicide rates among males by race, 2018 — 202426
| White overall suicide | Black overall suicide | AI/AN overall suicide | Asian overall suicide | White firearm suicide | Black firearm suicide | AI/AN firearm suicide | Asian firearm suicide | |
|---|---|---|---|---|---|---|---|---|
| 2018 | 25.6 | 11.7 | 20.2 | 10.2 | 14.3 | 6.4 | 7.7 | 2.8 |
| 2019 | 25.1 | 11.9 | 19.9 | 10.3 | 13.9 | 6.6 | 6.8 | 2.9 |
| 2020 | 24.3 | 12.5 | 21.7 | 9.7 | 14.0 | 7.4 | 9.8 | 3.0 |
| 2021 | 25.2 | 13.9 | 24.9 | 10.0 | 15.0 | 8.8 | 10.4 | 3.4 |
| 2022 | 25.5 | 14.4 | 22.9 | 10.2 | 15.1 | 9.1 | 10.9 | 3.2 |
| 2023 | 25.1 | 14.5 | 20.4 | 10.1 | 15.0 | 9.2 | 9.5 | 3.8 |
| 2024 | 24.8 | 13.9 | 19.5 | 9.8 | 15.1 | 9.1 | 9.2 | 3.2 |
Figure 5. Suicide and firearm suicide rates among females by race, 2018 — 202427
| White overall suicide | Black overall suicide | AI/AN overall suicide | Asian overall suicide | White firearm suicide | Black firearm suicide | AI/AN firearm suicide | Asian firearm suicide | |
|---|---|---|---|---|---|---|---|---|
| 2018 | 7.1 | 2.8 | 7.0 | 3.8 | 2.3 | 0.8 | 1.5 | 0.5 |
| 2019 | 6.8 | 2.8 | 7.3 | 3.8 | 2.2 | 0.8 | 1.3 | 0.4 |
| 2020 | 6.2 | 2.8 | 7.2 | 3.6 | 2.1 | 0.8 | 1.5 | 0.4 |
| 2021 | 6.3 | 3.2 | 8.5 | 3.9 | 2.2 | 1.2 | 1.8 | 0.4 |
| 2022 | 6.5 | 3.3 | 8.8 | 3.9 | 2.3 | 1.3 | 1.6 | 0.5 |
| 2023 | 6.5 | 3.4 | 7.4 | 3.6 | 2.3 | 1.3 | 1.7 | 0.5 |
| 2024 | 6.2 | 3.3 | 6.4 | 3.7 | 2.3 | 1.3 | 1.5 | 0.6 |
Figure 6. Suicide and firearm suicide rates among individuals age 24 and younger, 2018 — 202428
| White overall suicide | Black overall suicide | AI/AN overall suicide | Asian overall suicide | White firearm suicide | Black firearm suicide | AI/AN firearm suicide | Asian firearm suicide | |
|---|---|---|---|---|---|---|---|---|
| 2018 | 7.1 | 4.9 | 11.2 | 5.2 | 3.5 | 2.5 | 3.1 | 1.2 |
| 2019 | 6.8 | 5.0 | 10.2 | 4.8 | 3.2 | 2.4 | 3.0 | 1.2 |
| 2020 | 6.7 | 5.8 | 11.3 | 4.5 | 3.5 | 3.1 | 4.6 | 1.4 |
| 2021 | 7.1 | 6.7 | 12.3 | 5.7 | 3.9 | 4.0 | 4.1 | 1.8 |
| 2022 | 6.5 | 6.3 | 10.6 | 5.0 | 3.4 | 4.0 | 4.5 | 1.5 |
| 2023 | 6.4 | 6.3 | 8.6 | 5.1 | 3.5 | 3.8 | 3.3 | 1.7 |
| 2024 | 6.3 | 6.3 | 8.3 | 4.8 | 3.4 | 4.0 | 4.4 | 1.4 |
Figure 7. Suicide and firearm suicide rates among victims age 55 and older, 2018 — 202429
| White overall suicide | Black overall suicide | AI/AN overall suicide | Asian overall suicide | White firearm suicide | Black firearm suicide | AI/AN firearm suicide | Asian firearm suicide | |
|---|---|---|---|---|---|---|---|---|
| 2018 | 21.2 | 5.4 | 8.0 | 8.1 | 13.3 | 2.8 | 4.3 | 1.7 |
| 2019 | 20.6 | 5.1 | 7.3 | 8.3 | 12.9 | 2.7 | 3.3 | 1.7 |
| 2020 | 19.1 | 4.9 | 7.8 | 7.9 | 12.4 | 2.7 | 5.2 | 1.6 |
| 2021 | 19.7 | 4.7 | 9.6 | 6.8 | 13.0 | 2.8 | 5.4 | 1.2 |
| 2022 | 21.0 | 5.7 | 7.5 | 7.7 | 13.8 | 3.2 | 4.6 | 1.5 |
| 2023 | 20.7 | 5.8 | 6.8 | 7.4 | 13.6 | 3.2 | 4.5 | 2.0 |
| 2024 | 20.4 | 5.6 | 7.5 | 7.5 | 13.7 | 3.3 | 4.7 | 1.7 |
Copyright and Acknowledgments
Copyright © September 2026 Violence Policy Center
The Violence Policy Center (VPC) is a national nonprofit educational organization that conducts research and public education on violence in America and provides information and analysis to policymakers, journalists, advocates, and the general public.
This study was supported in part by a generous gift from Ellen Berman.
This study was authored by VPC Public Health Analyst Terra Wiens, MPH.
For a complete list of VPC publications with document links, please click here.
To learn more about the Violence Policy Center, please click here.
To make a tax-deductible contribution to help support our work, please click here.
Endnotes
- CDC WISQARS Fatal and Nonfatal Injury Reports. Accessed July and August 2026. Available at: https://wisqars.cdc.gov/reports/.
- Anglemyer A, Horvath T, Rutherford G. The Accessibility of Firearms and Risk for Suicide and Homicide Victimization Among Household Members. Annals of Internal Medicine. 2014;160:101-110.
- Siegel M, Rothman EF. Firearm Ownership and Suicide Rates Among US Men and Women, 1981-2013. American Journal of Public Health. 2016;106:1316-1322.
- Studdert DM, Zhang Y, Swanson SA, et al. Handgun Ownership and Suicide in California. New England Journal of Medicine. 2020;382:2220-2229.
- Miller M, Zhang Y, Prince L, et al. Suicide Deaths Among Women in California Living With Handgun Owners vs Those Living With Other Adults in Handgun-Free Homes, 2004-2016. JAMA Psychiatry. 2022;79(6):582-588.
- Conner A, Azrael D, Miller M. Suicide Case-Fatality Rates in the United States, 2007 to 2014: A Nationwide Population-Based Study. Annals of Internal Medicine. 2019;171:885-895.
- The VPC defines states with “stronger” gun violence prevention laws as those that add significant state regulation that is absent from federal law, such as restricting access to particularly hazardous and deadly types of firearms (for example, assault weapons), setting minimum safety standards for firearms and/or requiring a permit to purchase a firearm, and restricting the open and concealed carrying of firearms in public. States with “weaker” laws are defined as those who add little or nothing to federal law and have permissive laws governing the open or concealed carrying of firearms in public.
- Unless otherwise noted, all rates presented in this report are adjusted for age and per 100,000.
- CDC WISQARS Fatal and Nonfatal Injury Reports. Accessed July and August 2026. Available at: https://wisqars.cdc.gov/reports/.
- Schell, Terry L., Samuel Peterson, Brian G. Vegetabile, Adam Scherling, Rosanna Smart, and Andrew R. Morral, State-Level Estimates of Household Firearm Ownership. Santa Monica, CA: RAND Corporation, 2020. https://www.rand.org/pubs/tools/TL354.html.
- CDC WISQARS Fatal and Nonfatal Injury Reports. Accessed July and August 2026. Available at: https://wisqars.cdc.gov/reports/.
- Schell, Terry L., Samuel Peterson, Brian G. Vegetabile, Adam Scherling, Rosanna Smart, and Andrew R. Morral, State-Level Estimates of Household Firearm Ownership. Santa Monica, CA: RAND Corporation, 2020. https://www.rand.org/pubs/tools/TL354.html.
- CDC WISQARS Fatal and Nonfatal Injury Reports. Accessed July and August 2026. Available at: https://wisqars.cdc.gov/reports/.
- CDC WISQARS Fatal and Nonfatal Injury Reports. Accessed July and August 2026. Available at: https://wisqars.cdc.gov/reports/.
- CDC WISQARS Fatal and Nonfatal Injury Reports. Accessed July and August 2026. Available at: https://wisqars.cdc.gov/reports/.
- Victim race presented in this study include both Hispanic and non-Hispanic ethnicities.
- The racial category “Asian” includes Native Hawaiian and Pacific Islanders.
- CDC WISQARS Fatal and Nonfatal Injury Reports. Accessed July and August 2026. Available at: https://wisqars.cdc.gov/reports/.
- CDC WISQARS Fatal and Nonfatal Injury Reports. Accessed July and August 2026. Available at: https://wisqars.cdc.gov/reports/.
- CDC WISQARS Fatal and Nonfatal Injury Reports. Accessed July and August 2026. Available at: https://wisqars.cdc.gov/reports/.
- CDC WISQARS Fatal and Nonfatal Injury Reports. Accessed July and August 2026. Available at: https://wisqars.cdc.gov/reports/.
- CDC WISQARS Fatal and Nonfatal Injury Reports. Accessed July and August 2026. Available at: https://wisqars.cdc.gov/reports/.
- CDC WISQARS Fatal and Nonfatal Injury Reports. Accessed July and August 2026. Available at: https://wisqars.cdc.gov/reports/.
- CDC WISQARS Fatal and Nonfatal Injury Reports. Accessed July and August 2026. Available at: https://wisqars.cdc.gov/reports/.
- CDC WISQARS Fatal and Nonfatal Injury Reports. Accessed July and August 2026. Available at: https://wisqars.cdc.gov/reports/.
- CDC WISQARS Fatal and Nonfatal Injury Reports. Accessed July and August 2026. Available at: https://wisqars.cdc.gov/reports/.
- CDC WISQARS Fatal and Nonfatal Injury Reports. Accessed July and August 2026. Available at: https://wisqars.cdc.gov/reports/.
- CDC WISQARS Fatal and Nonfatal Injury Reports. Accessed July and August 2026. Available at: https://wisqars.cdc.gov/reports/.
- CDC WISQARS Fatal and Nonfatal Injury Reports. Accessed July and August 2026. Available at: https://wisqars.cdc.gov/reports/.