Gun violence affects all communities in the United States, but in different ways. This study, a joint project of WAVE Educational Fund1 and the Violence Policy Center,2 offers an overview of lethal gun violence in Wisconsin. Understanding how gun violence affects specific geographic locations and populations allows prevention efforts to be more effectively tailored to impacted communities.
This study utilizes 2024 data3 from the following sources:
- Mortality data from the WISQARS database maintained by the federal Centers for Disease Control and Prevention (CDC)
- Crime data submitted to the Federal Bureau of Investigation (FBI)
- Firearms trace data from the federal Bureau of Alcohol, Tobacco, Firearms and Explosives (ATF)
This report also contains the stories of family members who have lost loved ones to gun violence. Though statistics and analysis are necessary to aid in the development of effective public policy and increase public understanding of the true nature and scope of gun violence, it is imperative to never lose sight of the real-world impact of gun death and injury. The VPC and WAVE Educational Fund want to express their sincere appreciation to those who shared their experiences for this report. Their voices provide a critical, human context to this ongoing tragedy.
A quick note about race and ethnicity definitions:
The terms and definitions for race and ethnicity in this report are derived from U.S. Census Bureau definitions.
RACE
American Indian or Alaska Native — A non-Hispanic person having origins in any of the original peoples of North and South America (including Central America), and who maintains tribal affiliation or community attachment.
Asian — A non-Hispanic person having origins in any of the original peoples of the Far East (e.g., China, Japan), Southeast Asia (e.g., Vietnam, Thailand) or the India subcontinent (e.g., India, Pakistan). This report includes those commonly referred to as “Native Hawaiian or Other Pacific Islander” (a non-Hispanic person having origins in any of the original peoples of Hawaii, Guam, Samoa, or other Pacific Islands) in this category.
Black — A non-Hispanic person having origins in any of the Black racial groups of Africa.
White — A non-Hispanic person having origins in any of the original peoples of Europe, the Middle East, or North Africa.
ETHNICITY
Hispanic — A person of any race having origins in Mexico, Puerto Rico, Cuba, Central or South America, or other Spanish cultures.
Overall Gun Death in Wisconsin
Gun violence has a significant impact on communities: both nationally and in Wisconsin. In 2024, guns claimed 44,447 lives in the United States. Of these, 735 Wisconsin lives were lost to guns in suicides, homicides, and other firearm deaths (Table 1).
Table 1. Firearm deaths in Wisconsin, 2018 — 20244
| Firearm suicide | Firearm homicide | Unintentional firearm deaths | Total firearm deaths* | |
|---|---|---|---|---|
| 2018 | 420 | 153 | — | 598 |
| 2019 | 427 | 153 | — | 604 |
| 2020 | 442 | 253 | — | 717 |
| 2021 | 484 | 290 | — | 793 |
| 2022 | 529 | 277 | — | 830 |
| 2023 | 502 | 236 | — | 762 |
| 2024 | 507 | 207 | — | 735 |
— Indicates value has been suppressed because the number is too small to publish due to privacy concerns (nine or fewer deaths)
*Total firearm deaths include homicides, legal intervention deaths, suicides, unintentional deaths, and deaths of undetermined intent
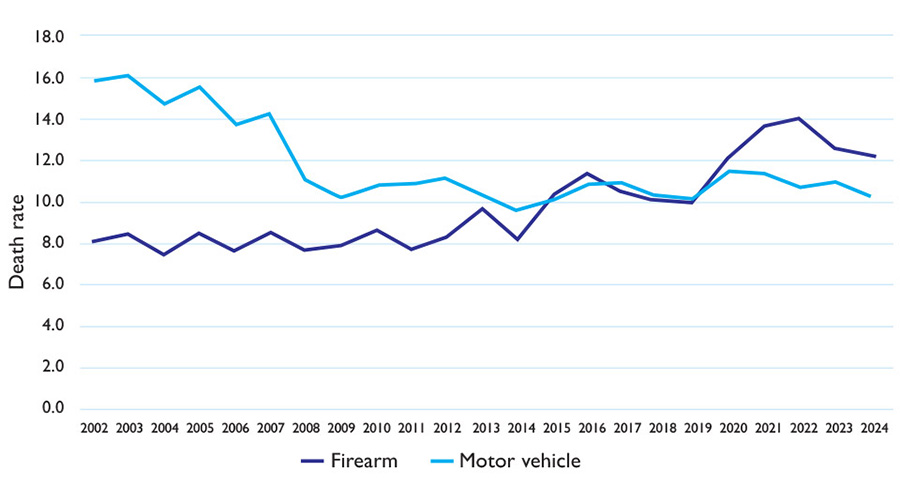
Since 2020, firearm deaths have outpaced motor vehicle deaths in Wisconsin, a shocking fact when one considers a person’s daily exposure to motor vehicles as opposed to firearms (Figure 1).
Figure 1. Rate5 of firearm deaths and motor vehicle deaths in Wisconsin,
2002 — 20246
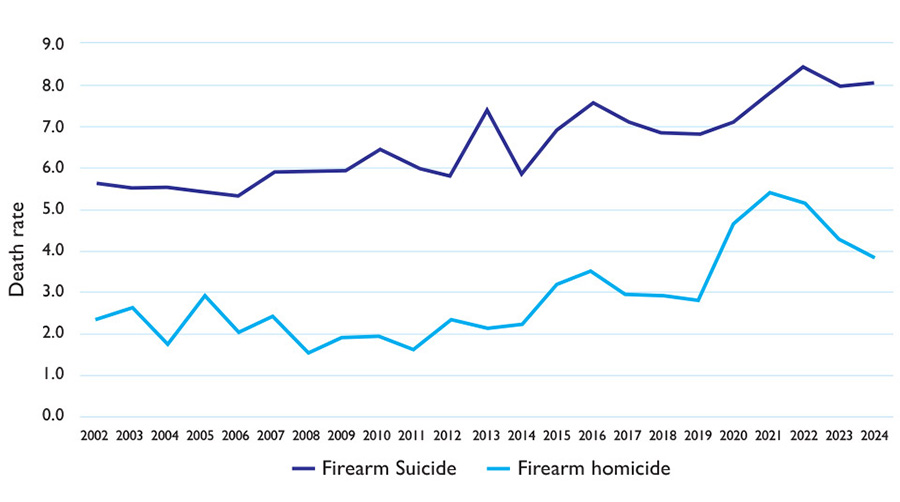
Rates of both suicides and homicides due to firearms have increased in Wisconsin over the last two decades (Figure 2). Though firearm suicide rates decreased between 2022 and 2024 from 8.4 per 100,000 to 8.0 per 100,000, rates are still substantially higher than they were two decades ago. After increasing drastically between 2019 and 2021, firearm homicide rates peaked in 2021 at 5.4 per 100,000 and have since decreased to 3.8 per 100,000 in 2024.
Figure 2. Rate of firearm suicide and firearm homicide in Wisconsin, 2002 — 20247
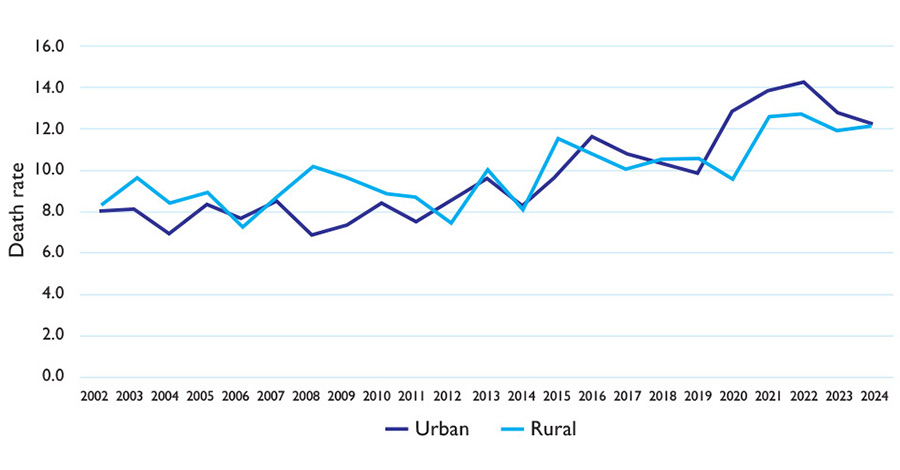
Over the last two decades there has been a general increase in rates of all firearm deaths in both rural and urban areas of the state,8 though there has been a decrease in urban rates in recent years (Figure 3). In 2024, the overall firearm death rate was 12.1 per 100,000 in both urban and rural areas.
Figure 3. Firearm death rates in Wisconsin by geography, 2002 — 20249
Alicia Villanueva
On August 18th, 2018, I sat at a stoplight, debating whether to stop by my brother Jakari’s house. I decided I could go tomorrow instead. I went home, turned off my phone, and closed my eyes.
Hours later, I got a call on my partner’s phone. It was our mother calling. She was yelling frantically. I couldn’t comprehend what she was telling me, couldn’t move. I thought, “Did she say my brother was dead? His father shot him?” We hung up, but I had to call her back and ask her which hospital to go to. She said that’s not where they take someone who’s dead.
I made my way to the police station. My family showed up to support me, but I ran outside and screamed at the top of my lungs until I fell to the ground. My brother didn’t exist anymore. He would have no more tomorrows. He was only 21.
Remembering who my brother was helped me process my emotions. Jakari would want me to forgive his father. This helped me attempt to move beyond something I could never understand. Still, something changed in me. It’s harder to trust people. A father is supposed to protect you, guide you, love you. If my brother’s father could take his life, how could I trust anyone?
Gun violence took away my ability to relax or even turn off my phone. I feel pressure to stay busy because if I stop for too long, I have to face the emptiness I carry inside. Breathing feels hard.
My brother’s estimated time of death was just before I sat at that stoplight and decided to go home. I often think about what could have happened if I’d gone to see Jakari. Would I have run into his dad? What would I have done if I saw my brother lying there in the hallway? Could I have saved him? These questions replay in my mind, with answers I will never have.
My brother was like a child to me; being that motherly sister to him was all I ever knew. I wanted the best for him. I knew he’d be an incredible man. It still breaks my heart that he will never experience another tomorrow due to senseless gun violence. Because that’s what gun violence is — senseless.

Suicide in Wisconsin
In 2024, 920 lives were lost to suicide in Wisconsin (Table 2). The majority of suicide victims (including those who died by firearm suicide) were male and white.
Table 2. Demographic characteristics of all suicide victims and firearm suicide victims in Wisconsin, 202410
| All suicide victims | Firearm suicide victims | |
|---|---|---|
| Total victims | 920 (100.0%) | 507 (100.0%) |
| Sex | ||
| Male | 743 (80.8%) | 459 (90.5%) |
| Female | 177 (19.2%) | 48 (9.5%) |
| Age | ||
| <10 | 0 (0.0%) | 0 (0.0%) |
| 10-24 | 110 (12.0%) | 55 (10.8%) |
| 25-44 | 295 (32.1%) | 160 (31.6%) |
| 45-64 | 326 (35.4%) | 163 (32.1%) |
| 65-79 | 134 (14.6%) | 82 (16.2%) |
| 80+ | 55 (6.0%) | 47 (9.3%) |
| Race and ethnicity | ||
| American Indian/Alaska Native | 13 (1.4%) | — |
| Asian* | 22 (2.4%) | — |
| Black | 28 (3.0%) | 18 (3.6%) |
| White | 809 (87.9%) | 457 (90.1%) |
| More than one race | 12 (1.3%) | — |
| Hispanic | 36 (3.9%) | 15 (3.0%) |
*The “Asian” category includes Native Hawaiians/Pacific Islanders
— Indicates value has been suppressed because the number is too small to publish due to privacy concerns (nine or fewer deaths)
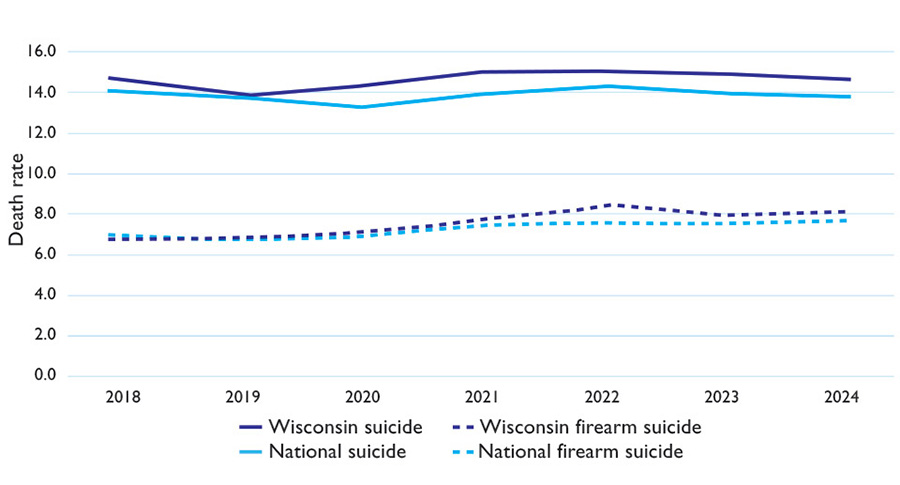
Rates of overall suicide and firearm suicide in Wisconsin are slightly higher compared to national rates (Figure 4).
Figure 4. Suicide and firearm suicide rates in Wisconsin and the U.S., 2018 — 202411
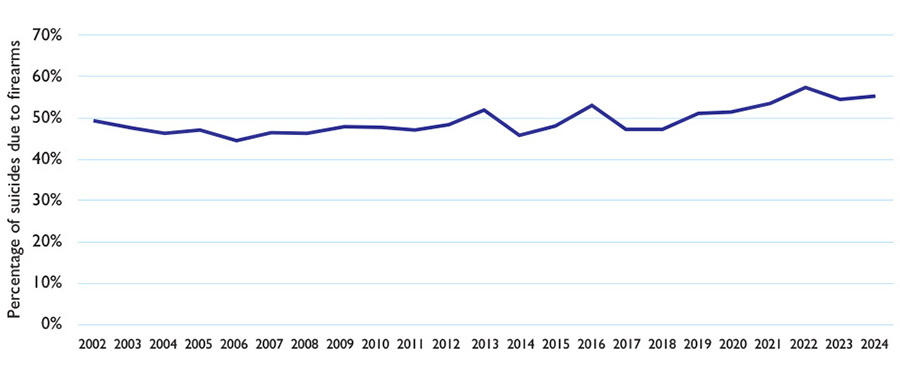
Understanding the role firearms play in suicide deaths is important to developing suicide prevention strategies. The percentage of suicides due to firearms in Wisconsin has increased in recent years, from 47.0 percent in 2017 to 57.3 percent in 2022, before decreasing to 55.1 percent in 2024 (Figure 5).
Figure 5. Percentage of suicides in Wisconsin due to firearms, 2002 — 202412
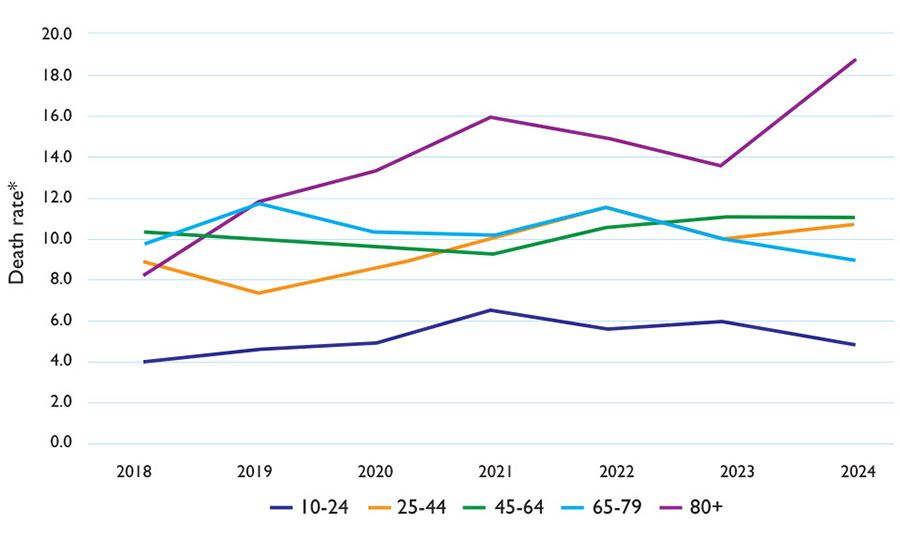
Examining firearm suicide rates for different age groups reveals important differences (Figure 6). Wisconsin residents ages 80 and older have the highest rates of firearm suicide, and this rate increased substantially between 2023 and 2024, from 13.5 per 100,000 to 18.7 per 100,000. Firearm suicide rates increased between 2021 and 2023 among those ages 45 to 64, from 9.2 per 100,000 to 11.0 per 100,000 and this rate remained stable at 11.0 per 100,000 in 2024.
Figure 6. Firearm suicide rates* in Wisconsin by age group, 2018 — 202413
*Rates are not adjusted for age
Suicide by firearm also varies by race and ethnicity in Wisconsin. Though the white population in Wisconsin has historically had the highest rate of suicide by firearm in the state, the Black population surpassed this disturbing metric in 2022 (Figure 7). Between 2018 and 2022 the firearm suicide rate among Black Wisconsin residents more than tripled — from 3.0 per 100,000 to 9.4 per 100,000. The firearm suicide rate decreased to 4.7 per 100,000 among Black Wisconsin residents in 2024.
Figure 7. Firearm suicide rates in Wisconsin by race and ethnicity, 2018 — 202414
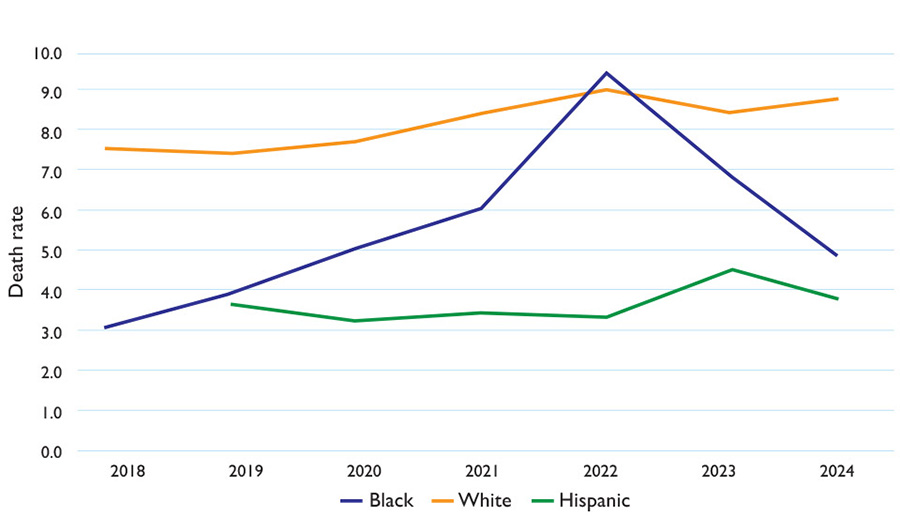
*The 2018 suicide death rate for the Hispanic population is suppressed due to a small number of deaths in this category
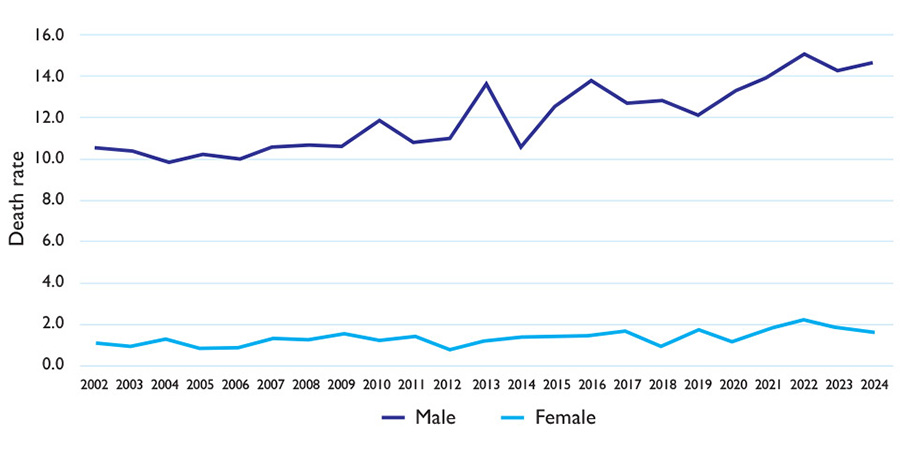
Males in Wisconsin have significantly higher firearm suicide rates compared to females, and rates have been increasing since 2019, from 12.1 per 100,000 to 14.6 per 100,000 in 2024 (Figure 8).
Figure 8. Firearm suicide rates in Wisconsin by sex, 2002 — 202415
Pardeep Kaleka
August 5th, 2012, began like a typical Sunday. I was driving my son and daughter to the Gurudwara, or Sikh Temple, while my wife was at work. My daughter had forgotten her notebook, so we turned back briefly before setting off again. This serendipitous mistake is why we survived.
When we finally reached the temple, an officer blocked the street and told me it was “an active shooting scene.” Without being able to fully absorb those words, my phone instantaneously began exploding with calls. A temple elder called from my dad’s phone and told me in Punjabi that my father had been shot and needed assistance. That call was interrupted by one from my mom, who whispered that she was hiding in a closet with other women and they needed help.
I attempted to gain access to the critical incident command post, which was the bowling alley across from the Gurudwara. Survivors were being taken there. My kids went with friends, while I searched for my parents. It took three hours to find my mom. When I asked her about Dad, she simply cried. We called every hospital in the area. Twelve hours after the shooting began, officials confirmed my father was among the deceased victims. I remember staring with anger at the officer who told me, even though she was only the messenger. My dad was dead.
In the days that followed, I learned the shooter was a white power skinhead. We asked ourselves how this could happen.
The shooting lasted six minutes. Seven people were killed; four others were injured. It is still impacting thousands of people today. Some Sikhs grew more guarded after that day. I decided to meet the tragedy with compassionate courage. In Sikhi, we speak of Chardhi Kala. It means, “We move in relentless optimism.” Chardhi Kala and compassion mean finding purpose in what happens. The shooter came to divide us, to tell us that we didn’t belong. Chardhi Kala means the opposite: responding by reaching out, uniting people, and ensuring that hate never happens again.
Going forward, we need to recognize that gun ownership is a responsibility to be taken seriously. People like the white supremacist, who killed my father and my community members, shouldn’t have had access to guns. We need to have discussions about gun violence, and we need to take action.

Suicide and geography
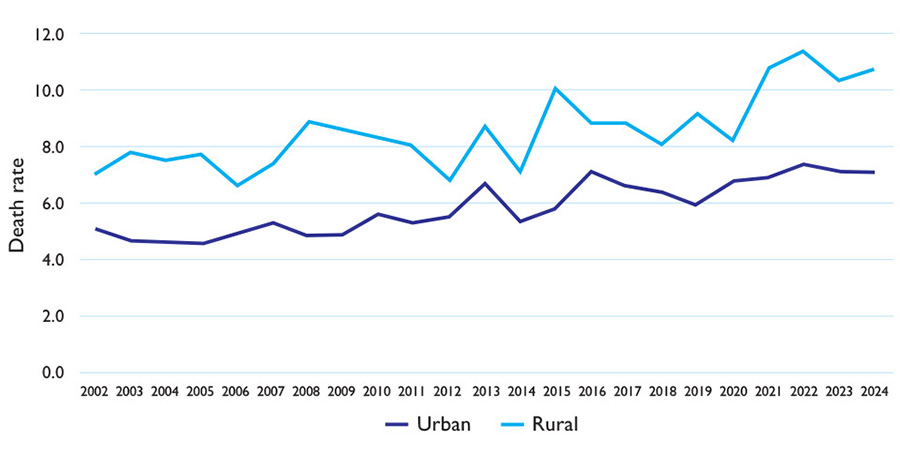
Over the last two decades, firearm suicide rates have remained higher in rural Wisconsin compared to urban areas (Figure 9). Though rates have increased statewide in recent years, the increase was more pronounced in rural areas: rates jumped from 8.2 per 100,000 in 2020 to 11.4 per 100,000 in 2022. While the urban rate of firearm suicide decreased to 7.1 per 100,000 in 2023 and remained stable through 2024, the rural rate decreased to 10.3 per 100,000 in 2023 before increasing to 10.7 per 100,000 in 2024. Both rural and urban rates of firearm suicide are substantially higher than they were two decades ago.
Figure 9. Firearm suicide rates in Wisconsin by geography, 2002 — 202416
Males in rural areas have the highest rates of firearm suicide compared to those in urban areas as well as females (Figure 10). The rate of firearm suicides among males in rural areas increased from 18.1 per 100,000 in 2023 to 19.5 per 100,000 in 2024.
Figure 10. Firearm suicide rates in Wisconsin by sex and geography, 2018 — 202417
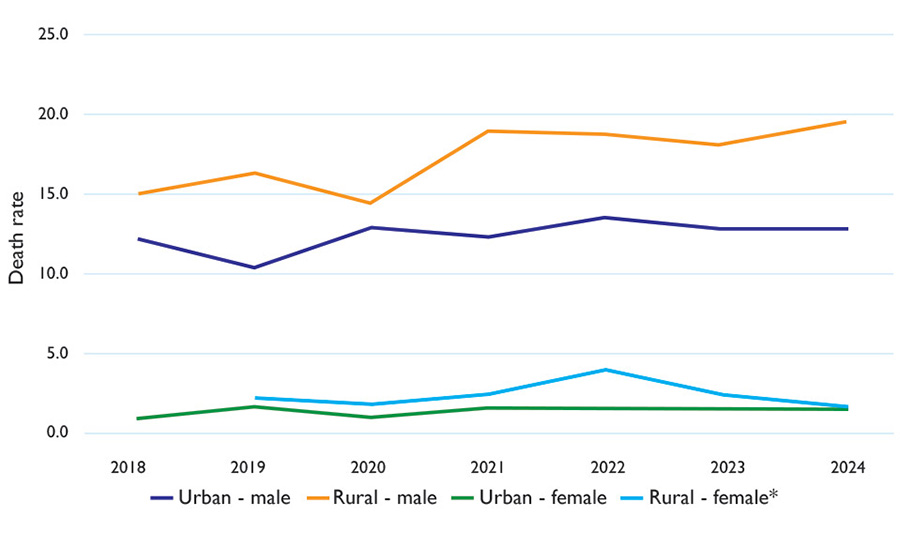
*The 2018 suicide death rate for the rural female population is suppressed due to the small number of deaths in this category
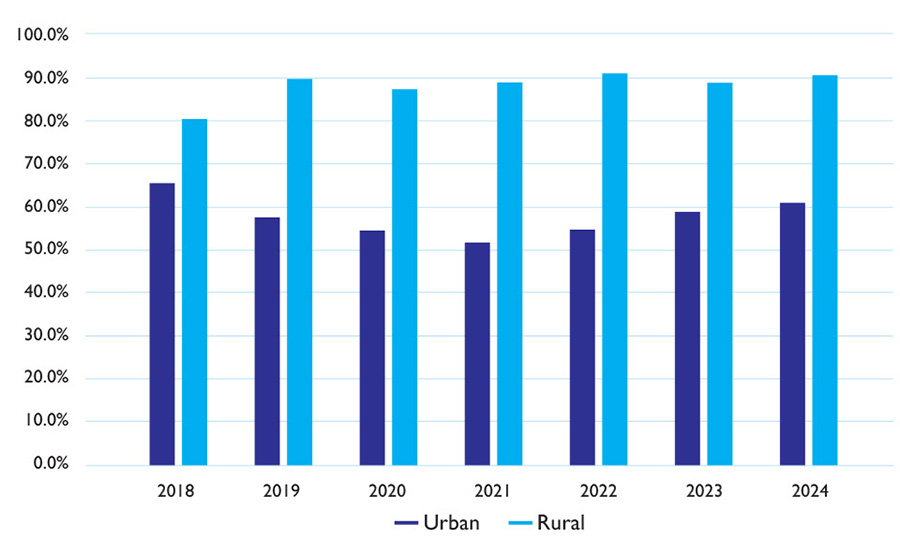
Indeed, the majority of firearm deaths in rural areas of Wisconsin are suicide deaths (Figure 11). In 2024, 90.8 percent of all firearm deaths in rural areas were firearm suicide deaths, while 61.1 percent of all firearm deaths in urban areas were firearm suicide deaths.
Figure 11. Percentage of firearm deaths in Wisconsin due to suicide by geography, 2018 — 202418
Homicide in Wisconsin
In 2024, 266 lives were lost to homicide in Wisconsin (Table 3). The majority of homicide victims (including those who died by firearm homicide) were male and Black.
Table 3. Demographic characteristics of all homicide victims and firearm homicide victims in Wisconsin, 202419
| All homicide victims | Firearm homicide victims | |
|---|---|---|
| Total victims | 266 (100.0%) | 207 (100.0%) |
| Sex | ||
| Male | 207 (77.8%) | 166 (80.2%) |
| Female | 59 (22.2%) | 41 (19.8%) |
| Age | ||
| <10 | 10 (3.8%) | — |
| 10-24 | 72 (27.1%) | 66 (31.9%) |
| 25-44 | 116 (43.6%) | 92 (44.4%) |
| 45-64 | 54 (20.3%) | 39 (18.8%) |
| 65-79 | 12 (4.5%) | — |
| 80+ | — | — |
| Race and ethnicity | ||
| American Indian/Alaska Native | — | — |
| Asian* | — | — |
| Black | 155 (58.3%) | 133 (64.3%) |
| White | 71 (26.7%) | 46 (22.2%) |
| More than one race | — | — |
| Hispanic | 32 (12.0%) | 23 (11.1%) |
*The “Asian” category includes Native Hawaiians/Pacific Islanders
— Indicates value has been suppressed because the number is too small to publish due to privacy concerns (nine or fewer deaths)
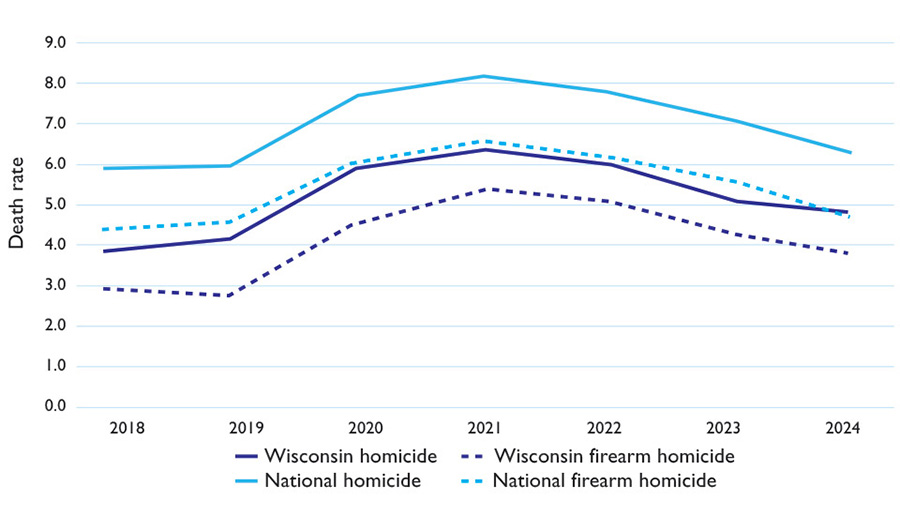
Homicide and firearm homicide rates are lower in Wisconsin compared to national rates, respectively (Figure 12).
Figure 12. Homicide and firearm homicide rates in Wisconsin and the U.S.,
2018 — 202420
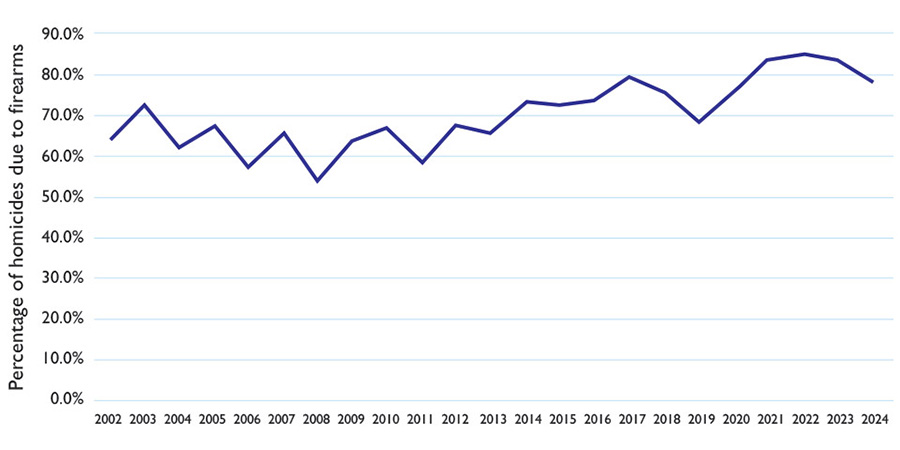
The percentage of homicides due to firearms peaked in 2022 at 84.7 percent and has since decreased to 77.8 percent in 2024 (Figure 13).
Figure 13. Percentage of homicides in Wisconsin due to firearms, 2002 — 202421
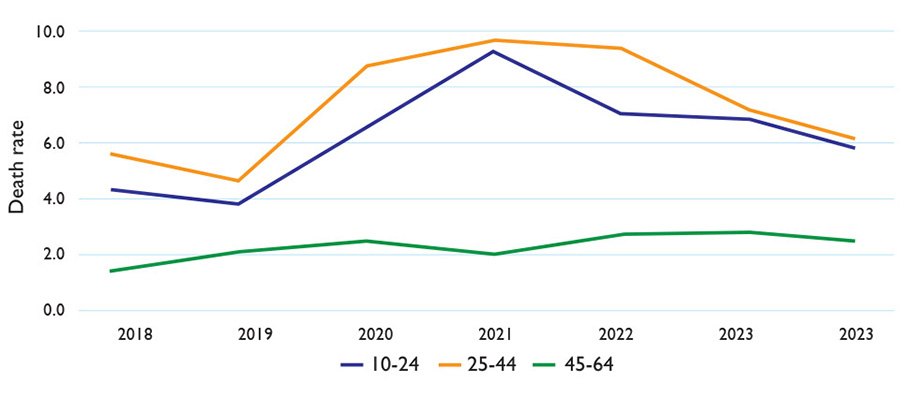
The highest firearm homicide rate in Wisconsin was among 25 to 44 year olds, increasing from 4.6 per 100,000 in 2019 to 9.6 per 100,000 in 2021, and then decreasing to 6.1 per 100,000 in 2024 (Figure 14). In recent years firearm homicide rates have been decreasing for 10 to 24 year olds and have remained relatively stable for 45 to 64 year olds.
Figure 14. Firearm homicide rates* in Wisconsin by age,** 2018 — 202422
*Rates are not adjusted for age
**Ages 65 and older are not shown on this graph due to small numbers in the older age groups
Debra Gillispie
On September 24, 2003, my life changed forever. My only son, Kirk Patrick Bickham Jr., was murdered alongside his friends Deshawn Winbush and Carl Hall in Milwaukee. The three young men were killed by a convicted felon who had access to a firearm. In an instant, three promising lives were taken, and three families were left to navigate unimaginable grief.
The days, months, and years that followed were filled with pain that words can scarcely describe. Like so many survivors of gun violence, I struggled to understand how life could continue after such devastating loss. I soon realized that while my son’s life had ended, my love for him had not. I had a choice: allow grief to consume me or transform that grief into purpose.
In 2005, I founded Mothers Against Gun Violence to honor Kirk’s life and the lives of Deshawn, Carl, and the countless others whose stories are too often reduced to headlines and statistics. Our mission is to elevate the voices of survivors of gun violence through the arts, media, and storytelling, reminding our communities that every victim was a person with dreams, relationships, and a future that was stolen.
My advocacy is also driven by the belief that no family should endure this kind of loss because of dangerous gaps in our laws that allowed someone prohibited from possessing a firearm to obtain one. That is why I support comprehensive background checks for all gun sales and transfers. Closing these loopholes is one important step toward keeping firearms out of the hands of people who are legally prohibited from possessing them and helping prevent future tragedies.
Although I continue to miss Kirk every day, his life continues to guide my purpose. By sharing our family’s story, I hope to honor the memories of Kirk, Deshawn, and Carl while encouraging others to see beyond the violence and recognize the humanity of those left behind. Their lives mattered. Their memories endure. And through advocacy, education, and compassion, I believe we can build safer communities where fewer families have to experience the heartbreak that has shaped mine.

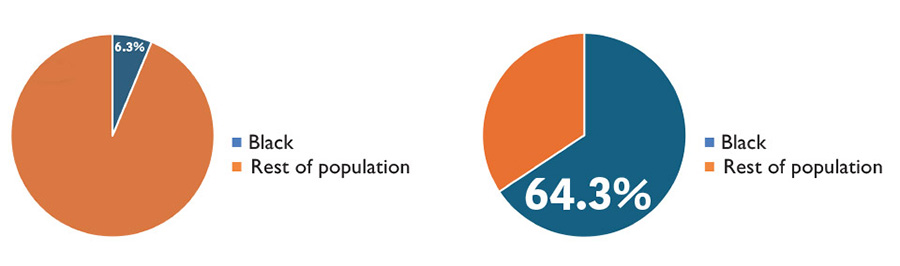
Significant racial disparities exist in Wisconsin with regard to firearm homicide. Though in 2024 only 6.3 percent of the Wisconsin population was Black, that year nearly two-thirds of firearm homicide victims in the state were Black (Figure 15).
Figure 15. Black percentage of Wisconsin population (left figure); Black percentage of firearm homicide victims in Wisconsin (right figure), 202423
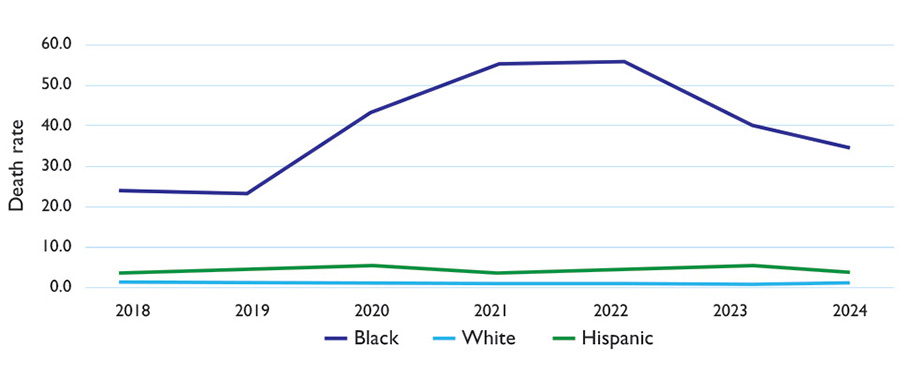
Though rates have remained relatively stable for the white, non-Hispanic population in the state, rates of firearm homicide have more than doubled among the Black, non-Hispanic population in Wisconsin — from 24.2 per 100,000 in 2018 to 55.8 per 100,000 in 2022 (Figure 16). Rates then decreased to 34.5 per 100,000 in 2024. In 2024, Black residents in Wisconsin were more than 34 times more likely to die by firearm homicide compared to white residents, for whom the firearm homicide rate was 1.0 per 100,000. The Violence Policy Center’s annual study Black Homicide Victimization in the United States found that in 2024 Wisconsin tied Illinois with the third highest rate of Black homicide victimization in the nation, surpassed only by Missouri and Mississippi.24 According to the study: “In 2024, Wisconsin had the largest disparity between Black and white homicide victimization rates — Black residents were 18.8 times more likely to die by homicide compared to white residents (38.6 per 100,000 compared to 2.1 per 100,000 respectively). This difference is nearly three times that of the overall United States, where Black individuals were 6.4 times more likely to die by homicide compared to white individuals (22.4 per 100,000 compared to 3.5 per 100.000).”
Firearm homicide rates have also increased among Hispanic Wisconsin residents, from 3.7 per 100,000 in 2021 to 5.6 per 100,000 in 2023 (Figure 16). Rates dropped to 3.8 per 100,000 in 2024.
Figure 16. Firearm homicide rates in Wisconsin by race and ethnicity, 2018 — 202425
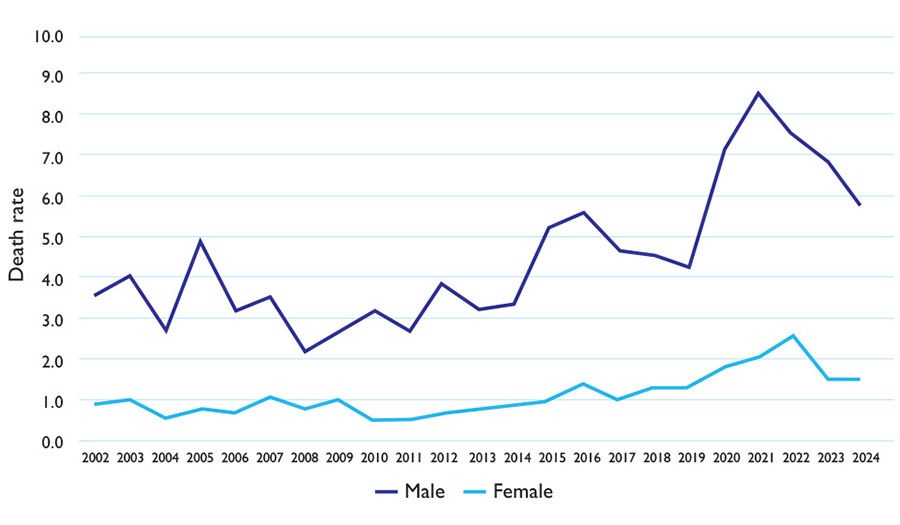
Firearm homicide rates have also increased more substantially among males in Wisconsin compared to females (Figure 17) — from 4.3 per 100,000 in 2019 to 8.6 per 100,000 in 2021. Over the last few years, rates among males have decreased to 5.9 per 100,000 in 2024.
Figure 17. Firearm homicide rates in Wisconsin by sex, 2002 — 202426
Firearm homicide rates increased dramatically in urban areas of the state between 2018 and 2021, from 3.3 per 100,000 to 6.7 per 100,000 (Figure 18). Rates have since decreased to 4.6 per 100,000 in 2024.
Figure 18. Firearm homicide rates in Wisconsin by geography, 2002 — 202427
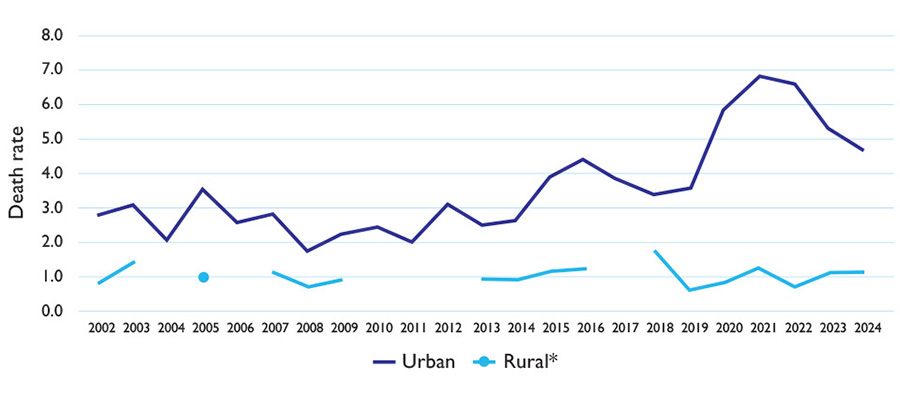
*The rural firearm homicide rate is suppressed for years 2004, 2006, 2010, 2011, 2012, and 2017 due to a small number of firearm homicide deaths in these years
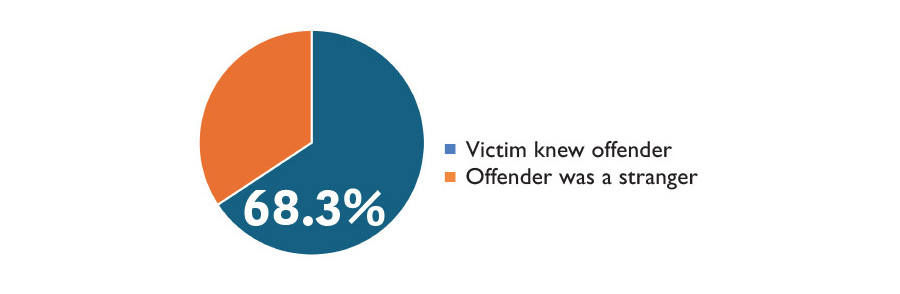
According to 2024 Federal Bureau of Investigation (FBI) crime data, for homicides in which the victim to offender relationship could be identified, 68.3 percent of Wisconsin homicide victims were killed by someone they knew (123 out of 180, Figure 19).
Figure 19. Percentage of homicide victims who knew their offender, Wisconsin, 202428
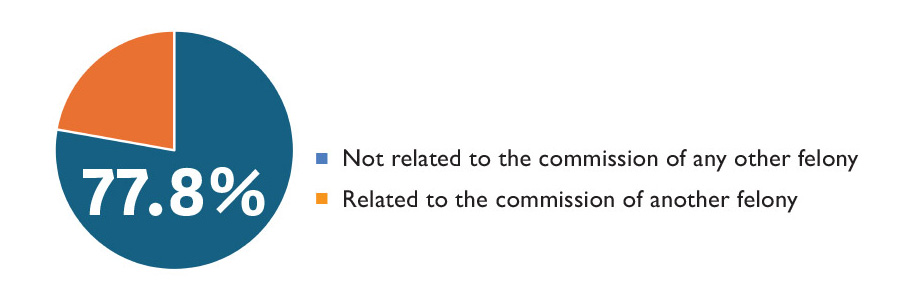
For Wisconsin homicides in which the circumstances were known, 77.8 percent (161 out of 207) were not related to the commission of any other felony (Figure 20). Of these, 36.7 percent (59 homicides) involved an argument between the victim and offender.
Figure 20. Percentage of homicides that were not related to the commission of any other felony, Wisconsin, 202429
Susan Schmidt
My brother, Scooter, was only a year younger than me. We were extremely close. He didn’t even talk until he was three or four because we had our own language. Scooter was a free spirit. He would help anyone; he never said no. He didn’t like to own things, even a car, so he was six foot, five inches on rollerblades all over Milwaukee.
On May 26th, 2005, at 5:30 AM, I got a call from my dad. Scoot had been shot. I didn’t ask a lot of questions, I just got in my car. We waited for hours at the hospital before an ICU nurse casually told us, “He’s never going to wake up. He’s brain dead.”
We went into his room, and it was so terrible; I knew he was gone. Both of my parents were crumbling, and I tried to hold them up. We told people not to come to the hospital, but hundreds of people showed up. He was so well known, so loved.
It was a home invasion. They got in through a door he’d left ajar while helping a neighbor.
Probably three thousand people came to his memorial; they closed down Water Street. It was such a beautiful celebration. There were so many people and stories.
Our gun laws are so weak — it’s easier to get a gun than a driver’s license. Because of that, there are children here in Milwaukee who see so many people they love being shot — their dad, sister, uncle. And some of those kids never get to see Lake Michigan or go bowling. So I started the Scooter Foundation in my brother’s memory.
Scooter had known so many people, it was easy to find someone who’d take 30 kids on a tour of their farm or on a boat for free. We started a community garden that has grown and is still thriving. We’d talk about how we feel, about how we can do things without violence.
It’s been 20 years, but this senseless act of violence still leaves us grieving and missing him terribly. We’ll never stop hurting. My whole theory is if I can make a difference in one kid’s life, my brother didn’t lose his life for nothing. There are still so many people who want to help. It proves the integrity of everything Scooter believed in, everything he did for others. Kindness matters.
Wisconsin Gun Deaths Compared to Other Great Lakes States
When compared to other Great Lakes states, Wisconsin had the fourth lowest overall firearm death rate, the second lowest firearm homicide death rate, and the fifth lowest firearm suicide death rate in 2024 (Table 4).
Table 4. Firearm death rates by state, 202430
| Overall firearm | Firearm suicide | Firearm homicide | |
|---|---|---|---|
| Wisconsin | 12.1 | 8.0 | 3.8 |
| Indiana | 17.2 | 10.6 | 5.8 |
| Ohio | 14.6 | 8.9 | 5.2 |
| Michigan | 11.9 | 7.4 | 4.3 |
| Pennsylvania | 11.9 | 7.4 | 4.2 |
| Illinois | 12.4 | 4.8 | 7.2 |
| Minnesota | 9.8 | 6.8 | 2.6 |
Wisconsin Crime Gun Trace Data from the Federal Bureau of Alcohol, Tobacco, Firearms and Explosives (ATF)
The vast majority of firearms recovered in Wisconsin originate in-state (83.7 percent, Figure 21). This percentage is similar to other Great Lakes states, with the exception of Illinois (Table 5).
Figure 21. Percentage of firearms sourced in the state of recovery for Great Lakes states, 202431

Table 5. Source states for firearms recovered in Great Lakes states, 202432
| In-state | Other named U.S. states and Puerto Rico | |
|---|---|---|
| Wisconsin | 5,773 (83.7%) | 1,123 (16.3%) |
| Illinois | 10,149 (54.0%) | 8,640 (46.0%) |
| Pennsylvania | 9,576 (79.8%) | 2,430 (20.2%) |
| Michigan | 6,282 (78.4%) | 1,745 (21.8%) |
| Ohio | 14,401 (84.3%) | 2,674 (15.7%) |
| Indiana | 8,170 (83.9%) | 1,567 (16.1%) |
| Minnesota | 3,020 (75.1%) | 1,000 (24.9%) |
In 2024, more than 8,100 firearms were recovered in Wisconsin and traced. The vast majority (82.8 percent) of the firearms recovered and traced were handguns — 76.6 percent were pistols and 6.2 percent were revolvers (Table 6).
Table 6. Firearm types with a Wisconsin recovery, 202433
| Number (%) recovered | |
|---|---|
| Pistols | 6,258 (76.6%) |
| Rifles | 744 (9.1%) |
| Revolvers | 507 (6.2%) |
| Shotguns | 412 (5.0%) |
| Machine Gun Conversion Devices | 56 (0.7%) |
| Derringers | 30 (0.4%) |
| Other* | 162 (2.0%) |
*Other includes Receivers/Frames, Silencers, Combinations, Machine Guns, Destructive Devices, and Unknown Types
More than one-third of firearms recovered in Wisconsin were traced because the weapon was under investigation (38.9 percent, Table 7).
Table 7. Top categories reported on firearm traces with a Wisconsin recovery, 202434
| Number (%) traced | |
|---|---|
| Firearm Under Investigation | 3,181 (38.9%) |
| Possession of Weapon | 1,725 (21.1%) |
| Carrying Concealed Weapon | 934 (11.4%) |
| Found Firearm | 383 (4.7%) |
| Dangerous Drugs | 331 (4.1%) |
| Weapon Offense | 316 (3.9%) |
| Family Offense | 225 (2.8%) |
| Suicide | 192 (2.4%) |
| Traffic Offense | 136 (1.7%) |
| Homicide | 93 (1.1%) |
| Other | 653 (8.0%) |
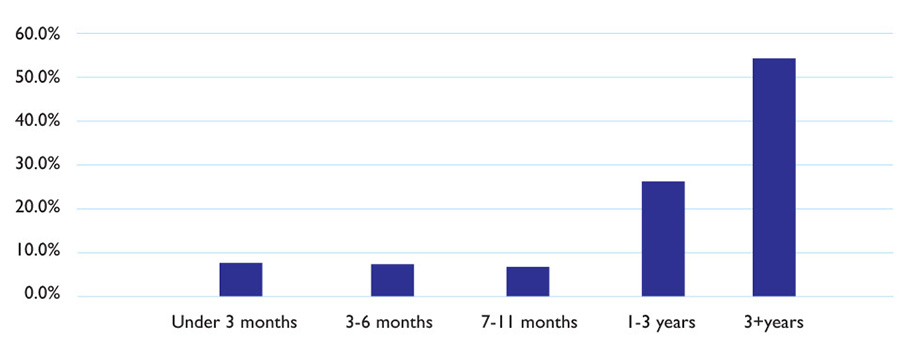
More than 50 percent of the firearms traced were first recovered by law enforcement three or more years after the weapon was originally purchased (Figure 22).
Figure 22. “Time-to-crime” percentages for firearms with a Wisconsin recovery,
202435
Where information about the age of possessors was available, nearly one-third of possessors were age 24 or younger (Table 8).
Table 8. Age of possessors of firearms with a Wisconsin recovery, 202436
| Age category | Number (%) traced |
|---|---|
| 17 and under | 302 (5.0%) |
| 18-24 | 1,401 (23.3%) |
| 25-30 | 1,241 (20.6%) |
| 31-50 | 2,361 (39.3%) |
| 51+ | 710 (11.8%) |
Over 40 percent of firearms recovered in Wisconsin were recovered in Milwaukee (Table 9).
Table 9. Top recovery cities for firearms with a Wisconsin recovery, 202437
| City | Number (%) traced |
|---|---|
| Milwaukee | 3,302 (40.4%) |
| Madison | 386 (4.7%) |
| West Allis | 322 (3.9%) |
| Racine | 291 (3.6%) |
| Kenosha | 246 (3.0%) |
| Green Bay | 198 (2.4%) |
| Appleton | 183 (2.2%) |
| Beloit | 135 (1.7%) |
| Wauwatosa | 128 (1.6%) |
| Janesville | 107 (1.3%) |
| La Crosse | 107 (1.3%) |
| Other municipalities | 2,761 (33.8%) |
Conclusion
Gun violence remains an ongoing public health crisis in Wisconsin. Firearms are playing an increasingly lethal role in both suicide and homicide deaths in the state. Key findings presented in this report include the following.
- Between 2018 and 2022, the firearm suicide rate among Black Wisconsin residents more than tripled — from 3.0 per 100,000 to 9.4 per 100,000 before decreasing to 4.7 per 100,000 in 2024.
- The firearm suicide rate has increased more rapidly in rural areas of Wisconsin compared to urban areas and was substantially higher in 2024 compared to two decades ago.
- Between 2019 and 2022, the firearm homicide rate among Black Wisconsin residents more than doubled from 24.2 per 100,000 to 55.8 per 100,000 before decreasing to 34.5 per 100,000 in 2024.
- Firearm homicide rates have increased dramatically among male Wisconsin residents, from 2.2 per 100,000 in 2008 to 8.6 per 100,000 in 2021. Rates then decreased to 5.9 per 100,000 in 2024.
- Firearm homicide rates have nearly quadrupled in urban areas of the state, from 1.7 per 100,000 in 2008 to 6.7 per 100,000 in 2021. Rates then decreased to 4.6 per 100,000 in 2024.
- The majority of homicide victims in Wisconsin knew their killer (68.3 percent).
- The majority of firearms recovered in Wisconsin originated in Wisconsin (83.7 percent) and handguns were the most common type of firearm recovered in the state and traced (76.6 percent were pistols and 6.2 percent were revolvers).
WAVE Educational Fund
WAVE Educational Fund is a statewide, grassroots organization dedicated to preventing gun violence, injuries, and deaths in Wisconsin through education and advocacy.
WAVE’s equity commitment is to cultivate a more equitable, violence-free society where we all feel a sense of security, belonging, value, and pride.
The data presented in this report describe the devastating impact of fatal gun violence
on Wisconsin residents. Wisconsin’s gun violence patterns, along with scientific evidence and outcomes from other states, point to several policy options worth considering in efforts to reduce gun violence:
- An extreme risk law, which would provide families and law enforcement officers a way to ask a judge to temporarily prohibit a person in crisis from purchasing or possessing a gun.
- A requirement for comprehensive gun purchaser screenings to help keep guns out of the hands of people who should not have them.
- A statewide domestic violence misdemeanor law aligned with federal law to more effectively disarm domestic abusers.
- More robust child access prevention policies to protect our youngest citizens from unintentional shootings.
- Statewide funding for community violence intervention (CVI) programs to help deescalate conflicts before they turn violent and connect people in underserved communities with essential resources.
For more information about WAVE’s work engaging with community members and partner organizations, as well as education and awareness efforts, please see waveedfund.org.
Appendix: Data for Figures Used in the Report
Figure 1. Rates of firearm deaths and motor vehicle deaths in Wisconsin,
2002 — 202438
| Firearm | Motor vehicle crash | |
|---|---|---|
| 2002 | 8.1 | 15.8 |
| 2003 | 8.4 | 16.0 |
| 2004 | 7.4 | 14.7 |
| 2005 | 8.5 | 15.6 |
| 2006 | 7.6 | 13.7 |
| 2007 | 8.5 | 14.3 |
| 2008 | 7.7 | 11.1 |
| 2009 | 7.9 | 10.2 |
| 2010 | 8.6 | 10.8 |
| 2011 | 7.7 | 10.8 |
| 2012 | 8.3 | 11.1 |
| 2013 | 9.7 | 10.3 |
| 2014 | 8.2 | 9.6 |
| 2015 | 10.3 | 10.1 |
| 2016 | 11.4 | 10.9 |
| 2017 | 10.5 | 10.9 |
| 2018 | 10.1 | 10.3 |
| 2019 | 10.0 | 10.1 |
| 2020 | 12.1 | 11.6 |
| 2021 | 13.6 | 11.4 |
| 2022 | 14.0 | 10.7 |
| 2023 | 12.6 | 10.9 |
| 2024 | 12.1 | 10.2 |
Figure 2. Rates of firearm suicide and firearm homicide in Wisconsin, 2002 — 202439
| Firearm suicide | Firearm homicide | |
|---|---|---|
| 2002 | 5.6 | 2.3 |
| 2003 | 5.5 | 2.6 |
| 2004 | 5.5 | 1.7 |
| 2005 | 5.4 | 2.9 |
| 2006 | 5.3 | 2.0 |
| 2007 | 5.9 | 2.4 |
| 2008 | 5.9 | 1.5 |
| 2009 | 5.9 | 1.9 |
| 2010 | 6.4 | 1.9 |
| 2011 | 6.0 | 1.6 |
| 2012 | 5.8 | 2.3 |
| 2013 | 7.3 | 2.1 |
| 2014 | 5.8 | 2.2 |
| 2015 | 6.9 | 3.2 |
| 2016 | 7.5 | 3.5 |
| 2017 | 7.1 | 2.9 |
| 2018 | 6.8 | 2.9 |
| 2019 | 6.8 | 2.8 |
| 2020 | 7.1 | 4.6 |
| 2021 | 7.8 | 5.4 |
| 2022 | 8.4 | 5.1 |
| 2023 | 7.9 | 4.2 |
| 2024 | 8.0 | 3.8 |
Figure 3. Firearm death rates in Wisconsin by geography, 2002 — 202440
| Urban | Rural | |
|---|---|---|
| 2002 | 8.0 | 8.2 |
| 2003 | 8.0 | 9.6 |
| 2004 | 6.9 | 8.3 |
| 2005 | 8.3 | 8.9 |
| 2006 | 7.6 | 7.2 |
| 2007 | 8.4 | 8.7 |
| 2008 | 6.8 | 10.1 |
| 2009 | 7.3 | 9.6 |
| 2010 | 8.3 | 8.9 |
| 2011 | 7.4 | 8.6 |
| 2012 | 8.5 | 7.4 |
| 2013 | 9.5 | 9.9 |
| 2014 | 8.1 | 8.2 |
| 2015 | 9.8 | 11.5 |
| 2016 | 11.6 | 10.7 |
| 2017 | 10.7 | 10.0 |
| 2018 | 10.1 | 10.5 |
| 2019 | 9.8 | 10.5 |
| 2020 | 12.9 | 9.5 |
| 2021 | 13.8 | 12.5 |
| 2022 | 14.3 | 12.7 |
| 2023 | 12.7 | 11.9 |
| 2024 | 12.1 | 12.1 |
Figure 4. Suicide and firearm suicide rates in Wisconsin and the U.S., 2018 — 202441
| Wisconsin suicide | Wisconsin firearm suicide | National suicide | National firearm suicide | |
|---|---|---|---|---|
| 2018 | 14.8 | 6.8 | 14.2 | 7.0 |
| 2019 | 14.0 | 6.8 | 13.9 | 6.8 |
| 2020 | 14.4 | 7.1 | 13.4 | 6.9 |
| 2021 | 15.1 | 7.8 | 14.0 | 7.5 |
| 2022 | 15.1 | 8.4 | 14.2 | 7.6 |
| 2023 | 14.9 | 7.9 | 14.0 | 7.6 |
| 2024 | 14.8 | 8.0 | 13.7 | 7.6 |
Figure 5. Percentage of suicides in Wisconsin due to firearms, 2002 — 202442
| Percentage | |
|---|---|
| 2002 | 49.1% |
| 2003 | 47.9% |
| 2004 | 46.5% |
| 2005 | 47.0% |
| 2006 | 44.6% |
| 2007 | 46.4% |
| 2008 | 46.3% |
| 2009 | 47.7% |
| 2010 | 47.7% |
| 2011 | 47.1% |
| 2012 | 48.1% |
| 2013 | 51.4% |
| 2014 | 45.8% |
| 2015 | 48.3% |
| 2016 | 52.5% |
| 2017 | 47.0% |
| 2018 | 47.3% |
| 2019 | 50.5% |
| 2020 | 51.0% |
| 2021 | 53.5% |
| 2022 | 57.3% |
| 2023 | 54.6% |
| 2024 | 55.1% |
Figure 6. Firearm suicide rates* in Wisconsin by age group, 2018 — 202443
| 10-24 | 25-44 | 45-64 | 65-79 | 80+ | |
|---|---|---|---|---|---|
| 2018 | 3.9 | 8.7 | 10.2 | 9.7 | 8.2 |
| 2019 | 4.6 | 7.3 | 9.8 | 11.7 | 11.8 |
| 2020 | 4.9 | 8.5 | 9.5 | 10.3 | 13.3 |
| 2021 | 6.5 | 9.9 | 9.2 | 10.1 | 15.9 |
| 2022 | 5.6 | 11.5 | 10.5 | 11.5 | 14.9 |
| 2023 | 5.9 | 9.9 | 11.0 | 10.0 | 13.5 |
| 2024 | 4.8 | 10.6 | 11.0 | 8.9 | 18.7 |
*Rates are not adjusted for age
Figure 7. Firearm suicide rates in Wisconsin by race and ethnicity, 2018 — 202444
| Black | White | Hispanic* | |
|---|---|---|---|
| 2018 | 3.0 | 7.5 | — |
| 2019 | 3.9 | 7.4 | 3.6 |
| 2020 | 5.0 | 7.7 | 3.2 |
| 2021 | 6.0 | 8.4 | 3.4 |
| 2022 | 9.4 | 9.0 | 3.3 |
| 2023 | 6.8 | 8.4 | 4.4 |
| 2024 | 4.7 | 8.8 | 3.7 |
*The 2018 death rate for the Hispanic population is suppressed due to a small number of deaths in this category
Figure 8. Firearm suicide rates in Wisconsin by sex, 2002 — 202445
| Male | Female | |
|---|---|---|
| 2002 | 10.5 | 1.1 |
| 2003 | 10.4 | 1.0 |
| 2004 | 9.8 | 1.3 |
| 2005 | 10.2 | 0.8 |
| 2006 | 10.0 | 0.9 |
| 2007 | 10.6 | 1.4 |
| 2008 | 10.7 | 1.3 |
| 2009 | 10.6 | 1.5 |
| 2010 | 11.9 | 1.2 |
| 2011 | 10.8 | 1.4 |
| 2012 | 11.0 | 0.8 |
| 2013 | 13.6 | 1.2 |
| 2014 | 10.5 | 1.4 |
| 2015 | 12.6 | 1.4 |
| 2016 | 13.8 | 1.4 |
| 2017 | 12.7 | 1.7 |
| 2018 | 12.8 | 0.9 |
| 2019 | 12.1 | 1.7 |
| 2020 | 13.2 | 1.2 |
| 2021 | 14.0 | 1.8 |
| 2022 | 15.0 | 2.1 |
| 2023 | 14.2 | 1.8 |
| 2024 | 14.6 | 1.6 |
Figure 9. Firearm suicide rates in Wisconsin by geography, 2002 — 202446
| Urban | Rural | |
|---|---|---|
| 2002 | 5.1 | 7.0 |
| 2003 | 4.7 | 7.8 |
| 2004 | 4.6 | 7.5 |
| 2005 | 4.6 | 7.7 |
| 2006 | 4.9 | 6.6 |
| 2007 | 5.3 | 7.4 |
| 2008 | 4.8 | 8.9 |
| 2009 | 4.9 | 8.6 |
| 2010 | 5.6 | 8.3 |
| 2011 | 5.3 | 8.0 |
| 2012 | 5.5 | 6.8 |
| 2013 | 6.7 | 8.7 |
| 2014 | 5.3 | 7.1 |
| 2015 | 5.8 | 10.1 |
| 2016 | 7.1 | 8.8 |
| 2017 | 6.6 | 8.8 |
| 2018 | 6.4 | 8.1 |
| 2019 | 5.9 | 9.2 |
| 2020 | 6.8 | 8.2 |
| 2021 | 6.9 | 10.8 |
| 2022 | 7.4 | 11.4 |
| 2023 | 7.1 | 10.3 |
| 2024 | 7.1 | 10.7 |
Figure 10. Firearm suicide rates in Wisconsin by sex and geography, 2018 — 202447
| Urban – male | Rural – male | Urban – female | Rural – female* | |
|---|---|---|---|---|
| 2018 | 12.2 | 15.0 | 0.9 | — |
| 2019 | 10.4 | 16.3 | 1.6 | 2.1 |
| 2020 | 12.9 | 14.4 | 1.0 | 1.8 |
| 2021 | 12.3 | 18.9 | 1.6 | 2.4 |
| 2022 | 13.5 | 18.8 | 1.6 | 4.0 |
| 2023 | 12.8 | 18.1 | 1.6 | 2.4 |
| 2024 | 12.8 | 19.5 | 1.6 | 1.7 |
*The 2018 suicide death rate for the rural female population is suppressed due to the small number of deaths in this category
Figure 11. Percentage of firearm deaths in Wisconsin due to suicide by geography, 2018 — 202448
| Urban | Rural | |
|---|---|---|
| 2018 | 66.4% | 81.0% |
| 2019 | 62.9% | 89.7% |
| 2020 | 55.0% | 86.7% |
| 2021 | 52.3% | 88.1% |
| 2022 | 54.4% | 91.0% |
| 2023 | 58.2% | 88.5% |
| 2024 | 61.1% | 90.8% |
Figure 12. Homicide and firearm homicide rates in Wisconsin and the U.S., 2018 — 202449
| Wisconsin homicide | Wisconsin firearm homicide | National homicide | National firearm homicide | |
|---|---|---|---|---|
| 2018 | 3.9 | 2.9 | 5.9 | 4.4 |
| 2019 | 4.2 | 2.8 | 6.0 | 4.6 |
| 2020 | 6.0 | 4.6 | 7.7 | 6.1 |
| 2021 | 6.4 | 5.4 | 8.2 | 6.6 |
| 2022 | 6.0 | 5.1 | 7.8 | 6.2 |
| 2023 | 5.1 | 4.2 | 7.0 | 5.6 |
| 2024 | 4.8 | 3.8 | 6.2 | 4.7 |
Figure 13. Percentage of homicides in Wisconsin due to firearms, 2002 — 202450
| Percentage | |
|---|---|
| 2002 | 63.9% |
| 2003 | 71.8% |
| 2004 | 61.6% |
| 2005 | 67.4% |
| 2006 | 56.7% |
| 2007 | 65.3% |
| 2008 | 52.9% |
| 2009 | 63.6% |
| 2010 | 66.7% |
| 2011 | 58.1% |
| 2012 | 67.4% |
| 2013 | 65.3% |
| 2014 | 72.9% |
| 2015 | 72.0% |
| 2016 | 73.4% |
| 2017 | 78.7% |
| 2018 | 75.0% |
| 2019 | 67.7% |
| 2020 | 75.7% |
| 2021 | 83.3% |
| 2022 | 84.7% |
| 2023 | 83.1% |
| 2024 | 77.8% |
Figure 14. Firearm homicide rates* in Wisconsin by age, 2018 — 202451
| 10-24 | 25-44 | 45-64 | |
|---|---|---|---|
| 2018 | 4.3 | 5.6 | 1.4 |
| 2019 | 3.8 | 4.6 | 2.1 |
| 2020 | 6.6 | 8.7 | 2.5 |
| 2021 | 9.2 | 9.6 | 2.0 |
| 2022 | 6.9 | 9.2 | 2.7 |
| 2023 | 6.8 | 7.1 | 2.8 |
| 2024 | 5.7 | 6.1 | 2.6 |
*Rates are not adjusted for age
Figure 16. Firearm homicide rates in Wisconsin by race and ethnicity, 2018 — 202452
| Black | White | Hispanic | |
|---|---|---|---|
| 2018 | 24.2 | 0.9 | 3.8 |
| 2019 | 23.0 | 0.8 | 4.5 |
| 2020 | 43.5 | 1.1 | 5.6 |
| 2021 | 55.1 | 1.1 | 3.7 |
| 2022 | 55.8 | 0.8 | 4.9 |
| 2023 | 39.7 | 1.0 | 5.6 |
| 2024 | 34.5 | 1.0 | 3.8 |
Figure 17. Firearm homicide rates in Wisconsin by sex, 2002 — 202453
| Male | Female | |
|---|---|---|
| 2002 | 3.6 | 0.9 |
| 2003 | 4.1 | 1.0 |
| 2004 | 2.7 | 0.6 |
| 2005 | 4.9 | 0.8 |
| 2006 | 3.2 | 0.7 |
| 2007 | 3.6 | 1.1 |
| 2008 | 2.2 | 0.8 |
| 2009 | 2.7 | 1.0 |
| 2010 | 3.2 | 0.5 |
| 2011 | 2.7 | 0.5 |
| 2012 | 3.9 | 0.7 |
| 2013 | 3.3 | 0.8 |
| 2014 | 3.4 | 0.9 |
| 2015 | 5.3 | 1.0 |
| 2016 | 5.7 | 1.4 |
| 2017 | 4.7 | 1.0 |
| 2018 | 4.6 | 1.3 |
| 2019 | 4.3 | 1.3 |
| 2020 | 7.2 | 1.8 |
| 2021 | 8.6 | 2.1 |
| 2022 | 7.5 | 2.6 |
| 2023 | 6.9 | 1.5 |
| 2024 | 5.9 | 1.5 |
Figure 18. Firearm homicide rates* in Wisconsin by geography, 2002 — 202454
| Urban | Rural | |
|---|---|---|
| 2002 | 2.7 | 0.8 |
| 2003 | 3.0 | 1.4 |
| 2004 | 2.0 | — |
| 2005 | 3.5 | 1.0 |
| 2006 | 2.5 | — |
| 2007 | 2.8 | 1.1 |
| 2008 | 1.7 | 0.7 |
| 2009 | 2.2 | 0.9 |
| 2010 | 2.4 | — |
| 2011 | 2.0 | — |
| 2012 | 3.0 | — |
| 2013 | 2.5 | 0.9 |
| 2014 | 2.6 | 0.9 |
| 2015 | 3.8 | 1.1 |
| 2016 | 4.3 | 1.2 |
| 2017 | 3.7 | — |
| 2018 | 3.3 | 1.7 |
| 2019 | 3.5 | 0.6 |
| 2020 | 5.7 | 0.8 |
| 2021 | 6.7 | 1.2 |
| 2022 | 6.5 | 0.7 |
| 2023 | 5.2 | 1.1 |
| 2024 | 4.6 | 1.1 |
*The rural firearm homicide rate is suppressed for years 2004, 2006, 2010, 2011, 2012, and 2017 due to a small number of firearm homicide deaths in these years
— Indicates value has been suppressed because the number is too small to publish due to privacy concerns (nine or fewer deaths)
Figure 21. Percentage of firearms sourced in the state of recovery for Great Lakes states, 202455
| State | Percentage |
|---|---|
| Wisconsin | 83.7% |
| Illinois | 54.0% |
| Pennsylvania | 79.8% |
| Michigan | 78.4% |
| Ohio | 84.3% |
| Indiana | 83.9% |
| Minnesota | 75.1% |
Figure 22. “Time-to-crime” percentages for firearms with a Wisconsin recovery, 202456
| Percentage | |
|---|---|
| Under 3 months | 6.9% |
| 3-6 months | 6.0% |
| 7-11 months | 6.1% |
| 1-3 years | 26.4% |
| 3+ years | 54.6% |
Copyright and Acknowledgments
Copyright © October 2026 Violence Policy Center and WAVE Educational Fund
This study was authored by VPC Public Health Analyst Terra Wiens, MPH.
This study was funded with the support of The Joyce Foundation.
The Violence Policy Center (VPC) is a national nonprofit educational organization that conducts research and public education on violence in America and provides information and analysis to policymakers, journalists, advocates, and the general public.
Violence Policy Center
805 15th Street, NW
Suite 601
Washington, DC 20005
202-822-8200
www.vpc.org
Wisconsin Anti-Violence Effort Educational Fund is a statewide grassroots organization dedicated to preventing gun violence, injuries and deaths through education and advocacy.
WAVE Educational Fund
P.O. Box 170393
Milwaukee, WI 53217
414-351-9283
waveedfund.org
Endnotes
- WAVE Educational Fund is a statewide, grassroots organization dedicated to preventing gun violence, injuries, and deaths in Wisconsin through education and advocacy. For more information, please see waveedfund.org.
- The Violence Policy Center (VPC) is a national research, education, and advocacy organization working to stop gun death and injury. For more information, please see www.vpc.org.
- At the time this study was researched and published, data from the year 2024 was the most comprehensive and recently available information from these sources.
- CDC WISQARS Fatal and Nonfatal Injury Reports. Accessed August 2026. Available at: https://wisqars.cdc.gov/reports.
- All death rates presented in this report are per 100,000 and adjusted for age unless otherwise noted.
- CDC WISQARS Fatal and Nonfatal Injury Reports. Accessed August 2026. Available at: https://wisqars.cdc.gov/reports.
- CDC WISQARS Fatal and Nonfatal Injury Reports. Accessed August 2026. Available at: https://wisqars.cdc.gov/reports.
- The terms “rural” and “urban” used in this report are based on the National Center for Health Statistics’ 2013 Urban-Rural Classification Scheme for Counties, which categorizes counties into six urbanization categories. The “rural” category (also known as “non-metro”) includes micropolitan and non-core counties and the “urban” category (also known as “metro”) includes counties considered large central metro, large fringe metro, medium metro, and small metro. More information is available at https://wisqars.cdc.gov/help/injury-reports/#data-filters-metro-non-metro-indicator.
- CDC WISQARS Fatal and Nonfatal Injury Reports. Accessed August 2026. Available at: https://wisqars.cdc.gov/reports.
- CDC WISQARS Fatal and Nonfatal Injury Reports. Accessed August 2026. Available at: https://wisqars.cdc.gov/reports.
- CDC WISQARS Fatal and Nonfatal Injury Reports. Accessed August 2026. Available at: https://wisqars.cdc.gov/reports.
- CDC WISQARS Fatal and Nonfatal Injury Reports. Accessed August 2026. Available at: https://wisqars.cdc.gov/reports.
- CDC WISQARS Fatal and Nonfatal Injury Reports. Accessed August 2026. Available at: https://wisqars.cdc.gov/reports.
- CDC WISQARS Fatal and Nonfatal Injury Reports. Accessed August 2026. Available at: https://wisqars.cdc.gov/reports.
- CDC WISQARS Fatal and Nonfatal Injury Reports. Accessed August 2026. Available at: https://wisqars.cdc.gov/reports.
- CDC WISQARS Fatal and Nonfatal Injury Reports. Accessed August 2026. Available at: https://wisqars.cdc.gov/reports.
- CDC WISQARS Fatal and Nonfatal Injury Reports. Accessed August 2026. Available at: https://wisqars.cdc.gov/reports.
- CDC WISQARS Fatal and Nonfatal Injury Reports. Accessed August 2026. Available at: https://wisqars.cdc.gov/reports.
- CDC WISQARS Fatal and Nonfatal Injury Reports. Accessed August 2026. Available at: https://wisqars.cdc.gov/reports.
- CDC WISQARS Fatal and Nonfatal Injury Reports. Accessed August 2026. Available at: https://wisqars.cdc.gov/reports.
- CDC WISQARS Fatal and Nonfatal Injury Reports. Accessed August 2026. Available at: https://wisqars.cdc.gov/reports.
- CDC WISQARS Fatal and Nonfatal Injury Reports. Accessed August 2026. Available at: https://wisqars.cdc.gov/reports.
- CDC WISQARS Fatal and Nonfatal Injury Reports. Accessed August 2026. Available at: https://wisqars.cdc.gov/reports.
- Violence Policy Center. Black Homicide Victimization in the United States: An Analysis of 2024 Homicide Data. Available at: https://vpc.org/publication/black-homicide-victimization-in-the-united-states-an-analysis-of-2024-homicide-data/.
- CDC WISQARS Fatal and Nonfatal Injury Reports. Accessed August 2026. Available at: https://wisqars.cdc.gov/reports.
- CDC WISQARS Fatal and Nonfatal Injury Reports. Accessed August 2026. Available at: https://wisqars.cdc.gov/reports.
- CDC WISQARS Fatal and Nonfatal Injury Reports. Accessed August 2026. Available at: https://wisqars.cdc.gov/reports.
- FBI Supplementary Homicide Report data. Downloaded from the Crime Data Explorer on March 15, 2026. Available at: https://cde.ucr.cjis.gov/LATEST/webapp/#/pages/home.
- FBI Supplementary Homicide Report data. Downloaded from the Crime Data Explorer on March 15, 2026. Available at: https://cde.ucr.cjis.gov/LATEST/webapp/#/pages/home.
- CDC WISQARS Fatal and Nonfatal Injury Reports. Accessed August 2026. Available at: https://wisqars.cdc.gov/reports.
- Bureau of Alcohol, Tobacco, Firearms and Explosives. Firearms Trace Data — 2024. Accessed September 4, 2026. Available at: https://www.atf.gov/firearms/report/firearms-trace-data/firearms-trace-data-wisconsin-2024.
- Bureau of Alcohol, Tobacco, Firearms and Explosives. Firearms Trace Data — 2024. Accessed September 4, 2026. Available at: https://www.atf.gov/firearms/report/firearms-trace-data/firearms-trace-data-wisconsin-2024.
- Bureau of Alcohol, Tobacco, Firearms and Explosives. Firearms Trace Data — 2024. Accessed September 4, 2026. Available at: https://www.atf.gov/firearms/report/firearms-trace-data/firearms-trace-data-wisconsin-2024.
- Bureau of Alcohol, Tobacco, Firearms and Explosives. Firearms Trace Data — 2024. Accessed September 4, 2026. Available at: https://www.atf.gov/firearms/report/firearms-trace-data/firearms-trace-data-wisconsin-2024.
- Bureau of Alcohol, Tobacco, Firearms and Explosives. Firearms Trace Data — 2024. Accessed September 4, 2026. Available at: https://www.atf.gov/firearms/report/firearms-trace-data/firearms-trace-data-wisconsin-2024.
- Bureau of Alcohol, Tobacco, Firearms and Explosives. Firearms Trace Data — 2024. Accessed September 4, 2026. Available at: https://www.atf.gov/firearms/report/firearms-trace-data/firearms-trace-data-wisconsin-2024.
- Bureau of Alcohol, Tobacco, Firearms and Explosives. Firearms Trace Data — 2024. Accessed September 4, 2026. Available at: https://www.atf.gov/firearms/report/firearms-trace-data/firearms-trace-data-wisconsin-2024.
- CDC WISQARS Fatal and Nonfatal Injury Reports. Accessed August 2026. Available at: https://wisqars.cdc.gov/reports.
- CDC WISQARS Fatal and Nonfatal Injury Reports. Accessed August 2026. Available at: https://wisqars.cdc.gov/reports.
- CDC WISQARS Fatal and Nonfatal Injury Reports. Accessed August 2026. Available at: https://wisqars.cdc.gov/reports.
- CDC WISQARS Fatal and Nonfatal Injury Reports. Accessed August 2026. Available at: https://wisqars.cdc.gov/reports.
- CDC WISQARS Fatal and Nonfatal Injury Reports. Accessed August 2026. Available at: https://wisqars.cdc.gov/reports.
- CDC WISQARS Fatal and Nonfatal Injury Reports. Accessed August 2026. Available at: https://wisqars.cdc.gov/reports.
- CDC WISQARS Fatal and Nonfatal Injury Reports. Accessed August 2026. Available at: https://wisqars.cdc.gov/reports.
- CDC WISQARS Fatal and Nonfatal Injury Reports. Accessed August 2026. Available at: https://wisqars.cdc.gov/reports.
- CDC WISQARS Fatal and Nonfatal Injury Reports. Accessed August 2026. Available at: https://wisqars.cdc.gov/reports.
- CDC WISQARS Fatal and Nonfatal Injury Reports. Accessed August 2026. Available at: https://wisqars.cdc.gov/reports.
- CDC WISQARS Fatal and Nonfatal Injury Reports. Accessed August 2026. Available at: https://wisqars.cdc.gov/reports.
- CDC WISQARS Fatal and Nonfatal Injury Reports. Accessed August 2026. Available at: https://wisqars.cdc.gov/reports.
- CDC WISQARS Fatal and Nonfatal Injury Reports. Accessed August 2026. Available at: https://wisqars.cdc.gov/reports.
- CDC WISQARS Fatal and Nonfatal Injury Reports. Accessed August 2026. Available at: https://wisqars.cdc.gov/reports.
- CDC WISQARS Fatal and Nonfatal Injury Reports. Accessed August 2026. Available at: https://wisqars.cdc.gov/reports.
- CDC WISQARS Fatal and Nonfatal Injury Reports. Accessed August 2026. Available at: https://wisqars.cdc.gov/reports.
- CDC WISQARS Fatal and Nonfatal Injury Reports. Accessed August 2026. Available at: https://wisqars.cdc.gov/reports.
- Bureau of Alcohol, Tobacco, Firearms and Explosives. Firearms Trace Data — 2024. Accessed September 4, 2026. Available at: https://www.atf.gov/resource-center/firearms-trace-data-2024.
- Bureau of Alcohol, Tobacco, Firearms and Explosives. Firearms Trace Data — 2024. Accessed September 4, 2026. Available at: https://www.atf.gov/resource-center/firearms-trace-data-2024.