
National Data
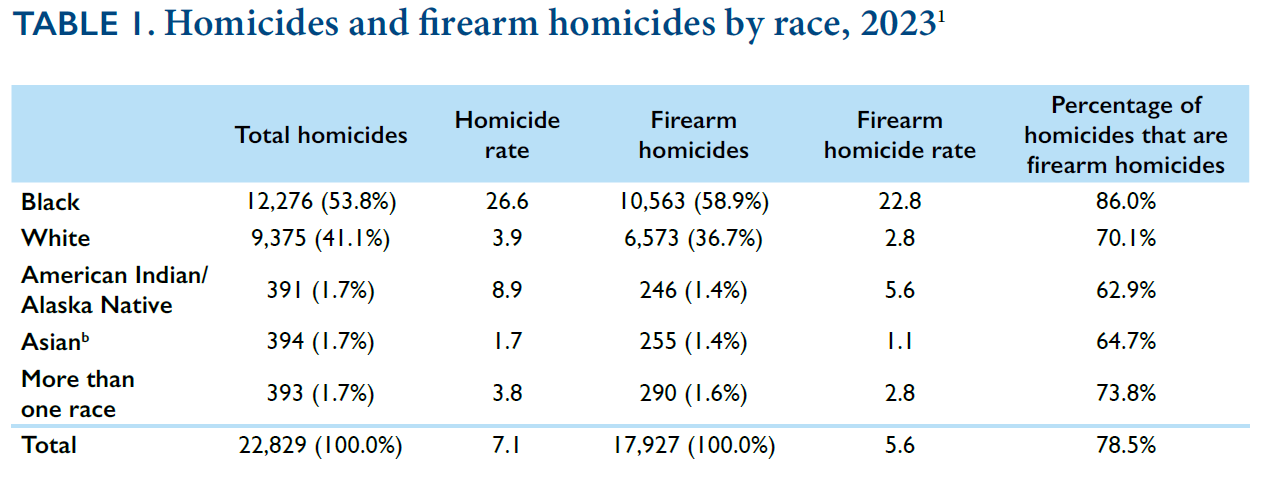
According to CDC mortality data, in 2023 there were 12,276 Black homicide victims in the United States (Table 1). The homicide rate1 among Black victims in the United States was 26.6 per 100,000.
For that year, the national homicide rate was 7.1 per 100,000. For white victims, the national homicide rate was 3.9 per 100,000. The Black homicide victimization rate was nearly four times the overall homicide victimization rate (26.6 per 100,000 compared to 7.1 per 100,000) and nearly seven times the white homicide victimization rate (26.6 per 100,000 compared to 3.9 per 100,000).
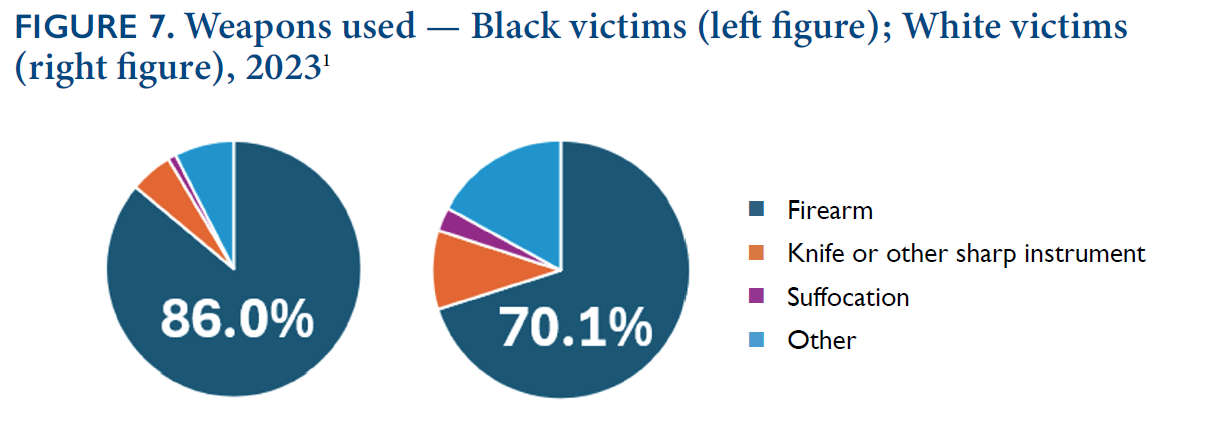
Firearms are more commonly used in homicides with Black victims compared to victims of other races. In 2023, 86.0 percent of Black homicide victims were killed with firearms, compared to 70.1 percent of white victims. In addition, nearly 60 percent of all firearm homicide victims were Black.
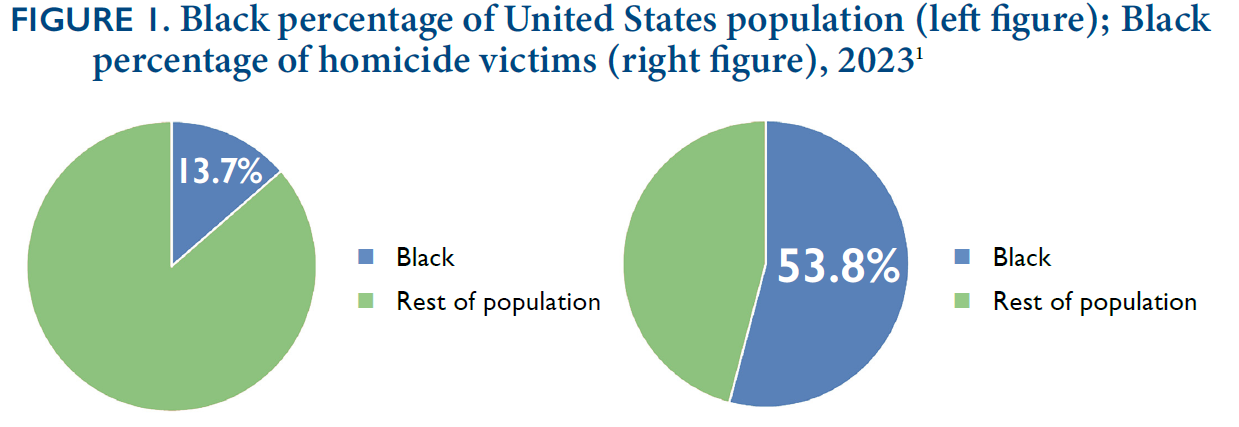
These racial disparities are particularly concerning when considering the racial breakdown of the United States population. While only 13.7 percent of the overall U.S. population is Black, more than half of all homicide victims in 2023 were Black (53.8 percent) (Figure 1).
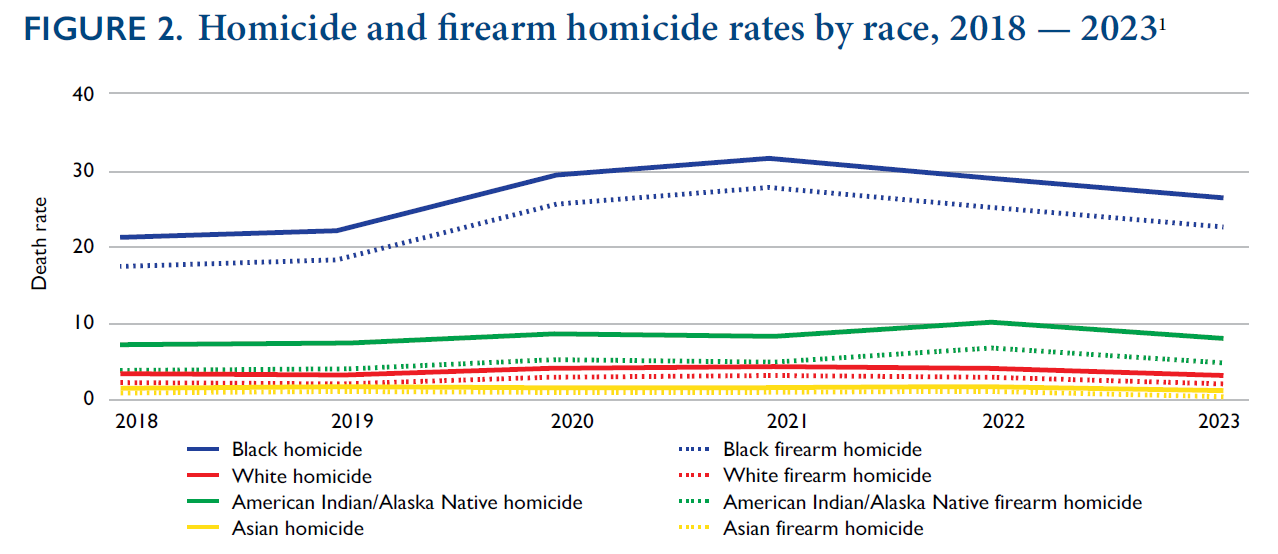
After increasing between 2018 and 2021, both homicide and firearm homicide rates decreased between 2021 and 2023 in the Black population (Figure 2). However, the homicide and firearm homicide rates in 2023 remain substantially higher than rates in 2018 — 25 percent higher for homicide (21.2 per 100,000 in 2018 compared to 26.6 per 100,000 in 2023) and 30 percent higher for firearm homicide (17.6 per 100,000 in 2018 compared to 22.8 per 100,000 in 2023).
Homicide was the number one cause of death among Black youth and young adults ages 10 to 24 in the United States in 2023, and the second leading cause of death among Black individuals ages one to nine and 25 to 34.2 In contrast, homicide was the third leading cause of death among White youth and young adults ages 15 to 24 in 2023 and the fourth leading cause of death among white children between the ages of one and nine years old.
Sex
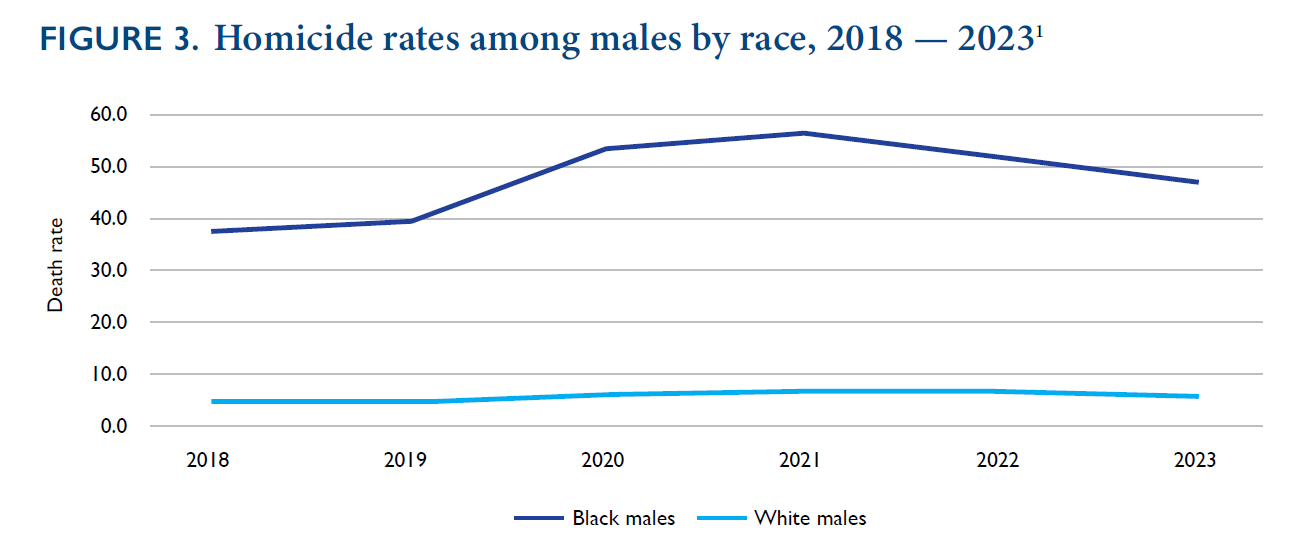
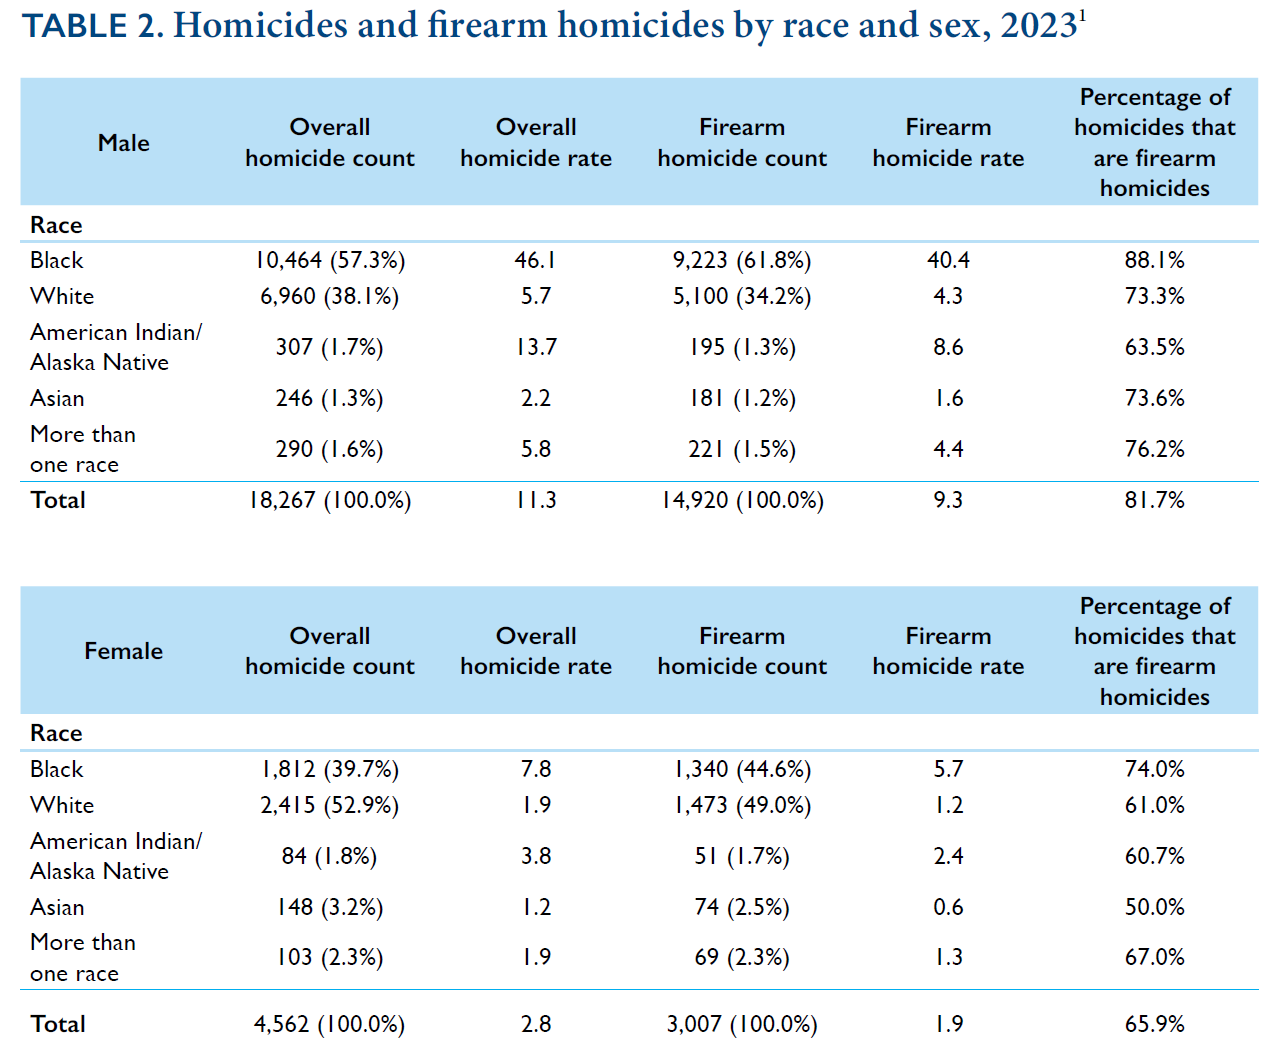
Of the 12,276 Black homicide victims, 10,464 (85.2 percent) were male and 1,812 (14.8 percent) were female. The homicide rate for Black male victims was more than four times the overall rate for male homicide victims (46.1 per 100,000 compared to 11.3 per 100,00) and more than eight times the rate for white male homicide victims (46.1 per 100,000 compared to 5.7 per 100,000) (Table 2). Figure 3 shows the disparity in homicide rates for white and Black male victims. While homicide rates remained relatively stable for white males between 2018 and 2023, rates increased drastically for Black males between 2019 and 2021, before decreasing in more recent years.
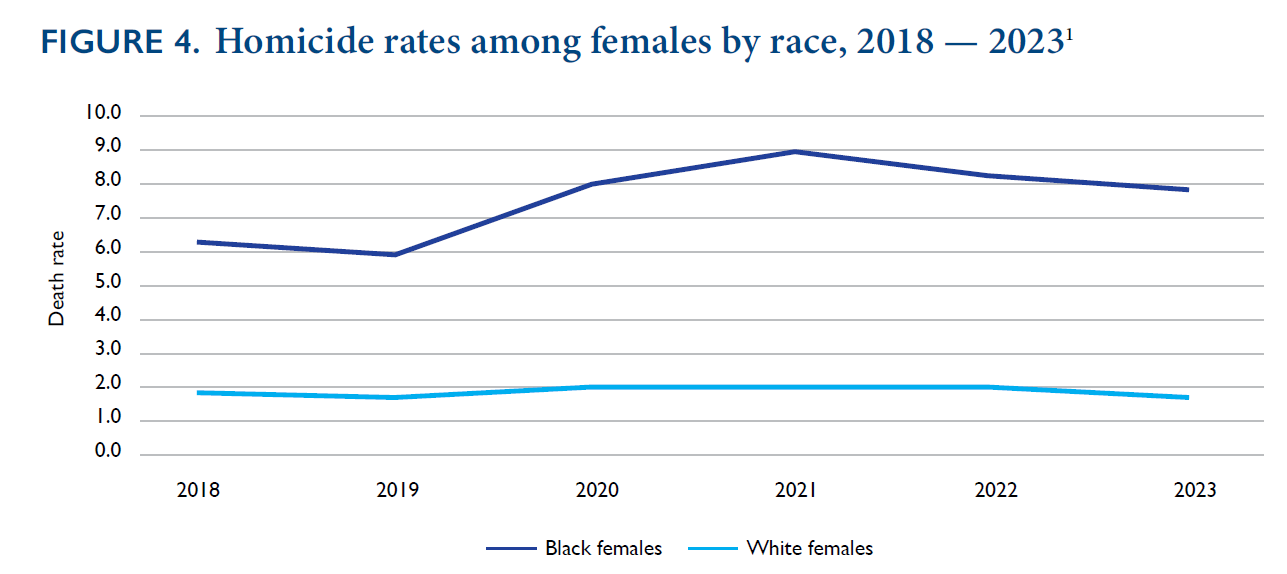
The homicide rate in 2023 for Black female victims was nearly three times the overall rate for female homicide victims (7.8 per 100,000 compared to 2.8 per 100,000) and more than four times the rate for white female homicide victims (7.8 per 100,000 compared to 1.9 per 100,000). The Black male homicide victimization rate was nearly six times the Black female homicide victimization rate (46.1 per 100,000 compared to 7.8 per 100,000). Homicide rates remained relatively stable for white females between 2018 and 2023. Yet, similar to Black males, rates increased drastically for Black females between 2019 and 2021 (Figure 4). Homicide rates have been decreasing more slowly for Black females compared to Black males in recent years — between 2021 and 2023 the homicide rate decreased 12.4 percent for Black females compared to 16.5 percent for Black males.
Both male and female Black victims are more likely to be killed with firearms compared to their white counterparts. In 2023, 73.3 percent of white male homicide victims were killed with firearms compared to 88.1 percent of Black male victims, while 61.0 percent of white female victims were killed with firearms compared to 74.0 percent of Black female victims.
Age
Among all Black homicide victims in 2023, 1,289 were under the age of 18 (10.5 percent) and 2,904 were ages 18 to 24 (23.7 percent). Three hundred and forty-one Black homicide victims (2.8 percent) were 65 years of age or older.
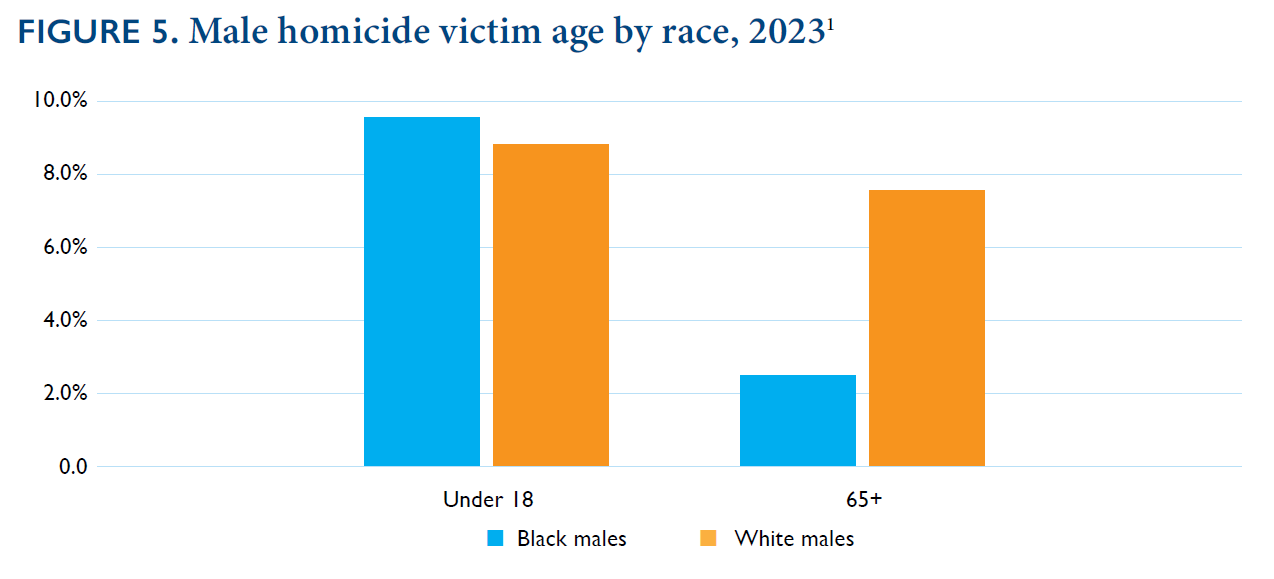
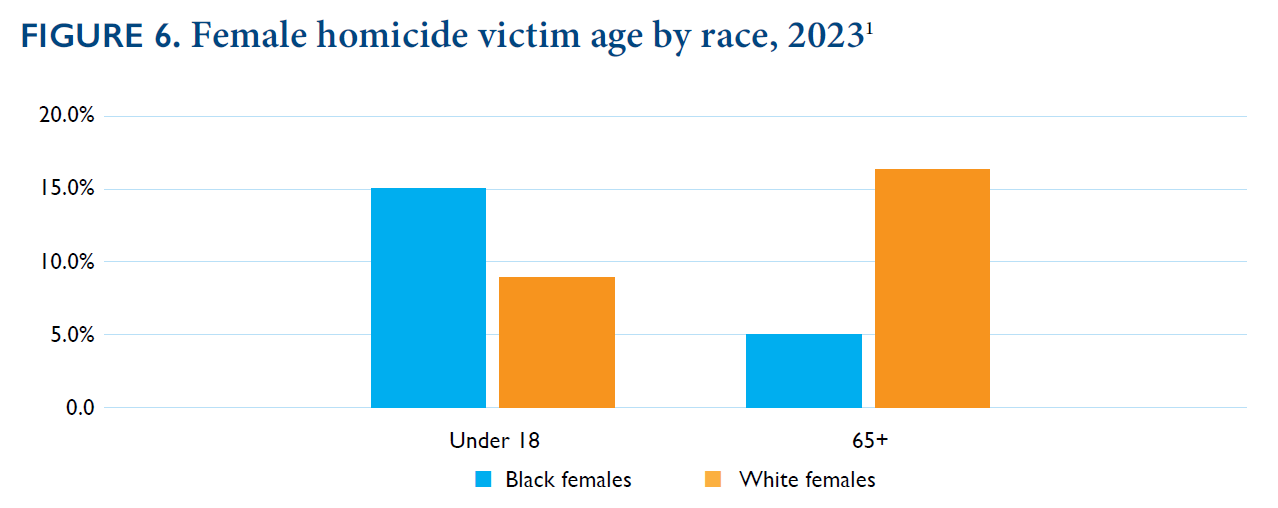
A slightly higher percentage of Black male victims were under the age of 18 compared to white male victims (9.7 percent compared to 8.9 percent), while a lower percentage of Black male victims were age 65 and older compared to their white counterparts (2.4 percent compared to 7.7 percent, Figure 5). The same pattern was seen among female homicide victims — 14.8 percent of Black female victims were under the age of 18 compared to 9.5 percent of white female victims, and 5.1 percent of Black female victims were age 65 and older compared to 16.1 percent for white female victims (Figure 6).
Most Common Weapons
A higher percentage of Black homicide victims were killed with firearms compared to white victims (Figure 7). In 2023, 86.0 percent of Black homicide victims were killed with firearms (10,563 out of 12,276). Six hundred sixty-three Black homicide victims were killed with knives or other sharp instruments (5.4 percent). In comparison, 70.1 percent of white victims (6,573 out of 9,375) and 78.5 percent of all victims (17,927 out of 22,829) were killed with firearms.
Victim-Offender Relationship and Circumstance Information From FBI Crime Data
As noted earlier, while this report does not use 2023 FBI crime data for state-by-state rankings, it does present information from this data set on victim to offender relationship as well as homicide circumstances (information not available in WISQARS) on the national level, as detailed below, and for the 10 states with the highest victimization rates.
Victim/Offender Relationship
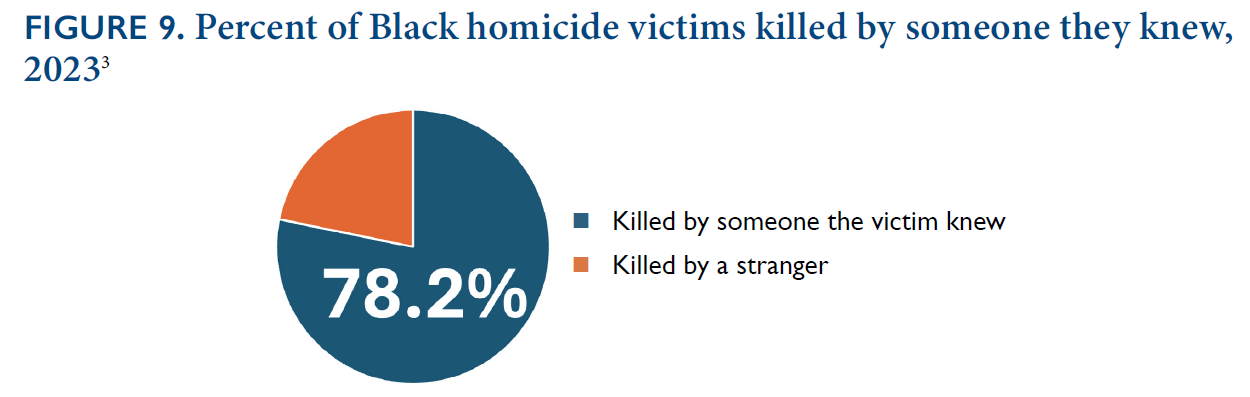
For homicides in which the victim to offender relationship could be identified, 78.2 percent of Black victims nationally (3,017 out of 3,860) were killed by someone they knew (Figure 9). Eight hundred forty-three victims were killed by strangers (21.8 percent).
Circumstance
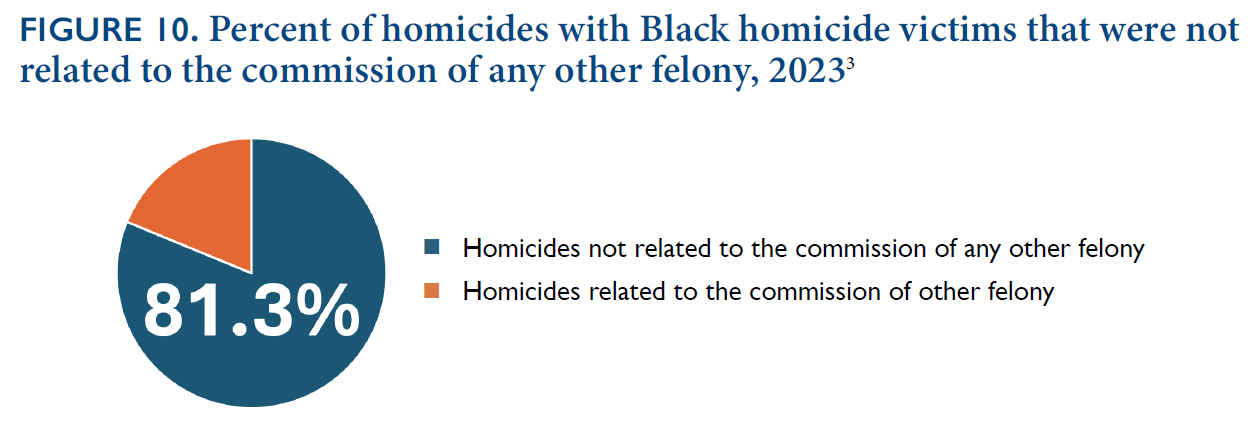
For homicides in which the circumstances could be identified, 81.3 percent (3,743 out of 4,607) were not related to the commission of any other felony (Figure 10). Of these, 55.4 percent (2,072 homicides) involved arguments between the victim and the offender.
There were 73 incidents reported as justifiable homicides of Black victims killed by law enforcement in 2023. FBI crime data do not specifically identify killings by law enforcement that are not ruled justifiable. In January 2019, the FBI began collecting data on violent police encounters in the National Use-of-Force Data Collection database. Limited use-of-force data are currently available online. In 2024, only 11,445 out of 19,277 federal, state, local, and tribal law enforcement agencies throughout the nation participated and provided use-of-force data.3 The officers employed by these agencies represent 72 percent of federal, state, local, and tribal sworn officers in the nation.
Back to Table of Contents
Next – Continued Spotlight on Missouri
- All rates presented in this study are per 100,000 and adjusted for age
- CDC WISQARS Leading Causes of Death. Accessed April 12, 2025. Available at: http://bit.ly/4eLmpME.
- Federal Bureau of Investigation, Crime Data Explorer, Law Enforcement Collections. Accessed April 12, 2025. Available at: https://cde.ucr.cjis.gov/LATEST/webapp/#/pages/le/uof.